
Cpk = 1.63, zero defects, and the auditor still rejects the process. Why?

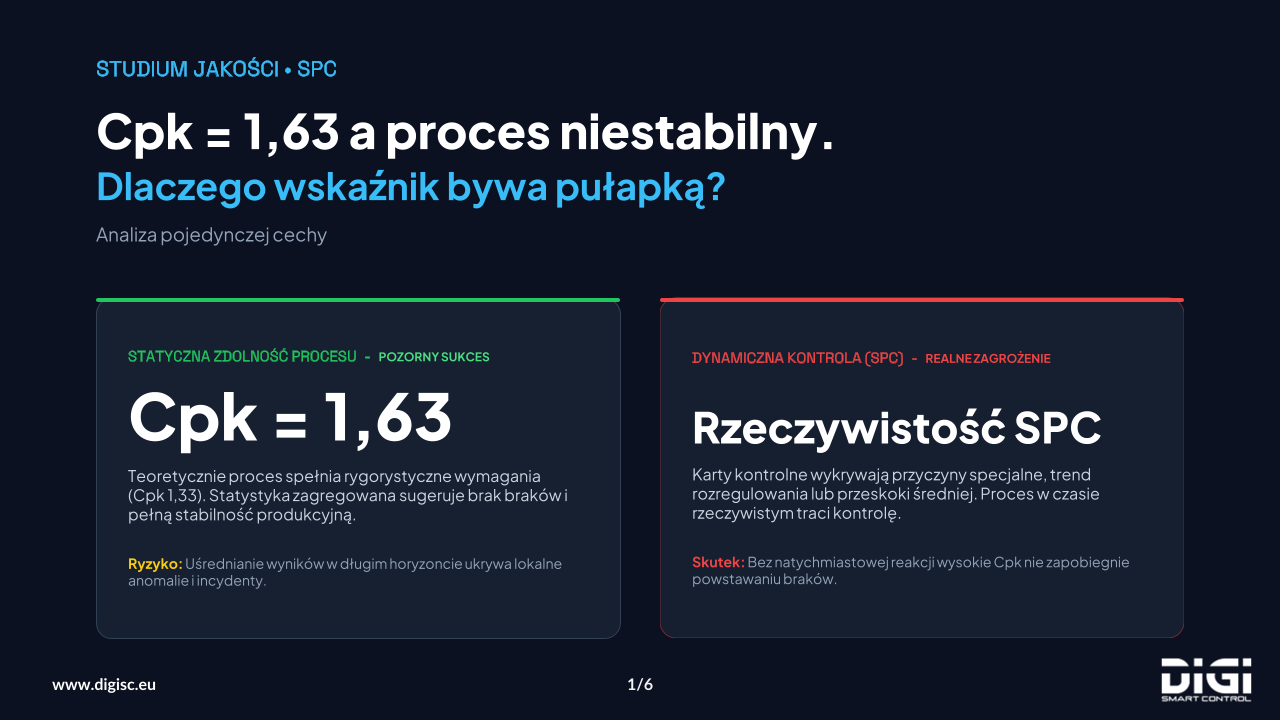
In quality reports, a Cpk above 1.33 is taken as proof of stable, repeatable production. In our example characteristic, everything looks right at first glance.
Averaged values, however, can lull you into a false sense of security.
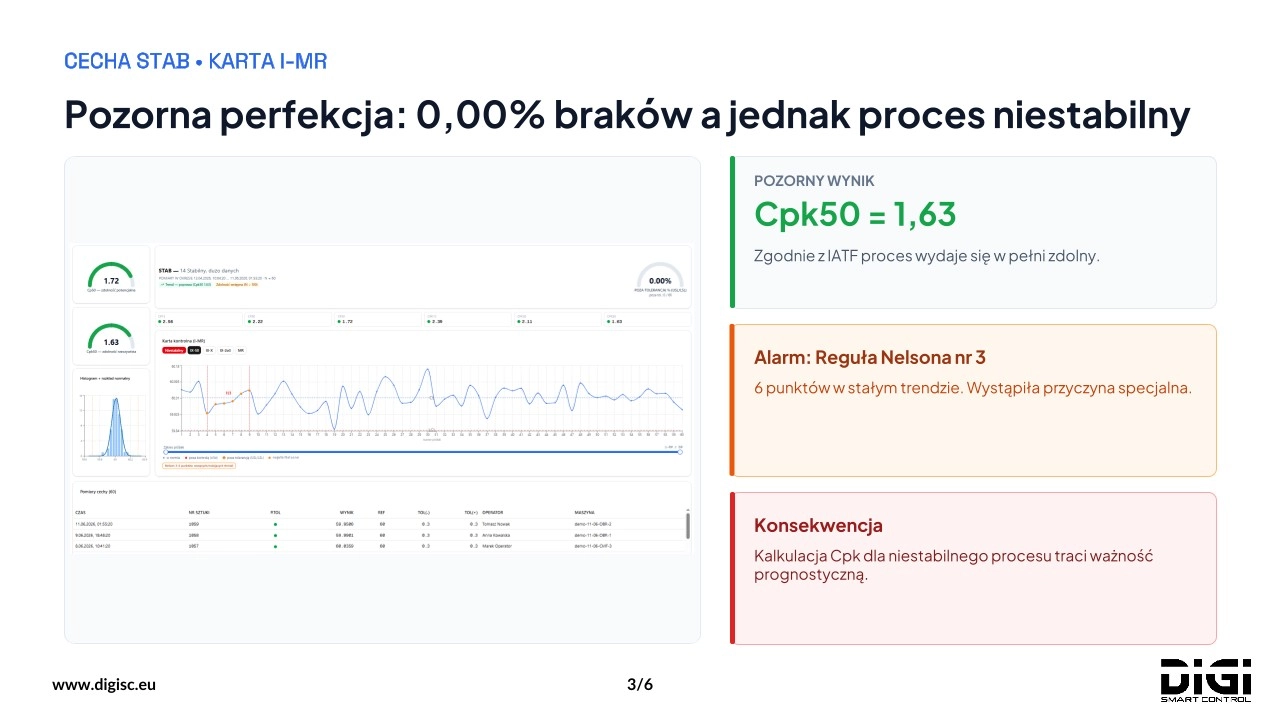
- Cp
- 1.72
- Cpk
- 1.63
- parts out of tolerance
- 0.00%
The I-MR chart tells a different story
Just look at the I-MR control chart. The system checks the measurements against the Nelson rules and flags the process state: unstable. The sequence of points meets Nelson rule 3, six consecutive points moving in one direction.
A trend signals a special cause. In machining, it may come from:
- tool wear,
- thermal drift of the spindle,
- a change of raw material batch.
Stability first, capability second
SPC methodology (the AIAG manual, ISO 22514, formerly ISO 21747) is clear: if a process is not statistically stable, calculating Cpk from a pooled sample is a methodological error. Such an index says nothing about what to expect from the next batches.
Rolling Cpk reveals the dip
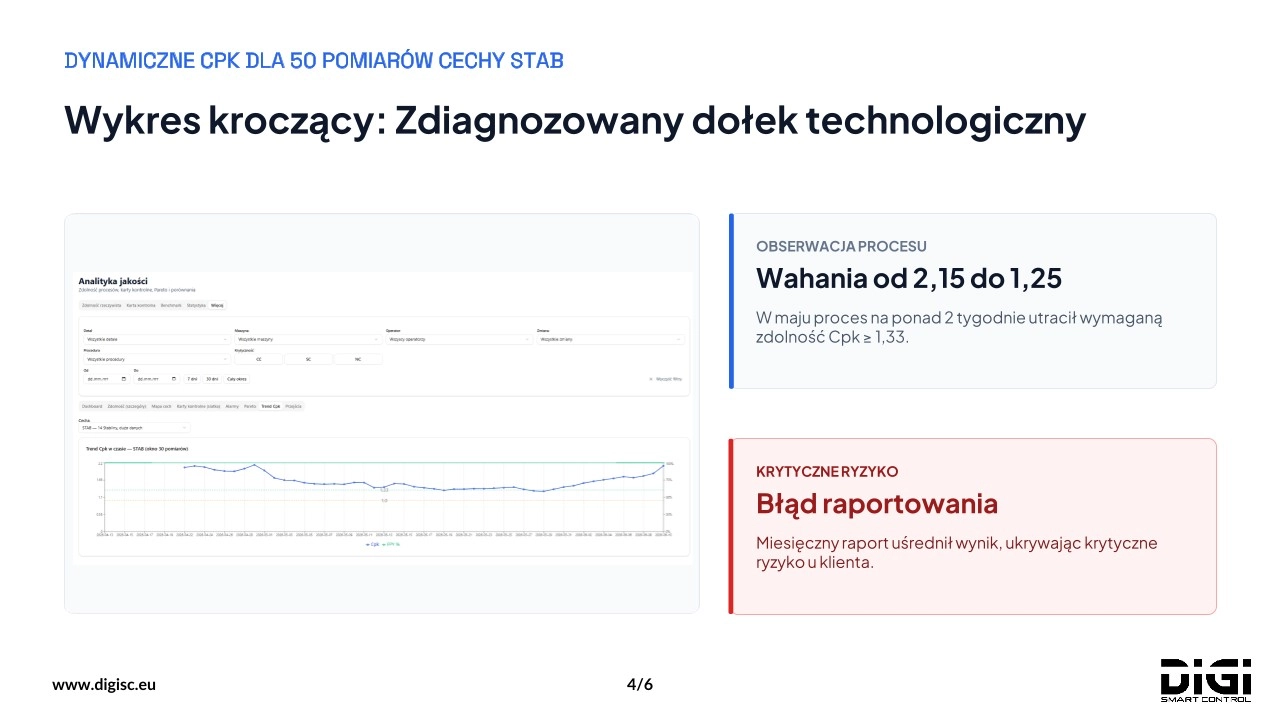
The real picture only appears with Cpk calculated over a rolling window. The beginning and end of the period show very good capability, with Cpk up to 2.15. In mid-May the process breaks down: for almost two weeks Cpk stays below the required 1.33 and drops to 1.25.
The pooled result for the whole month simply covered this drop up.
What it means for the customer
Had the customer examined parts from that two-week window, they would have received a batch with an elevated risk of defects. Meanwhile, the pooled report and the quality certificate looked flawless.
Three rules for a sound SPC assessment
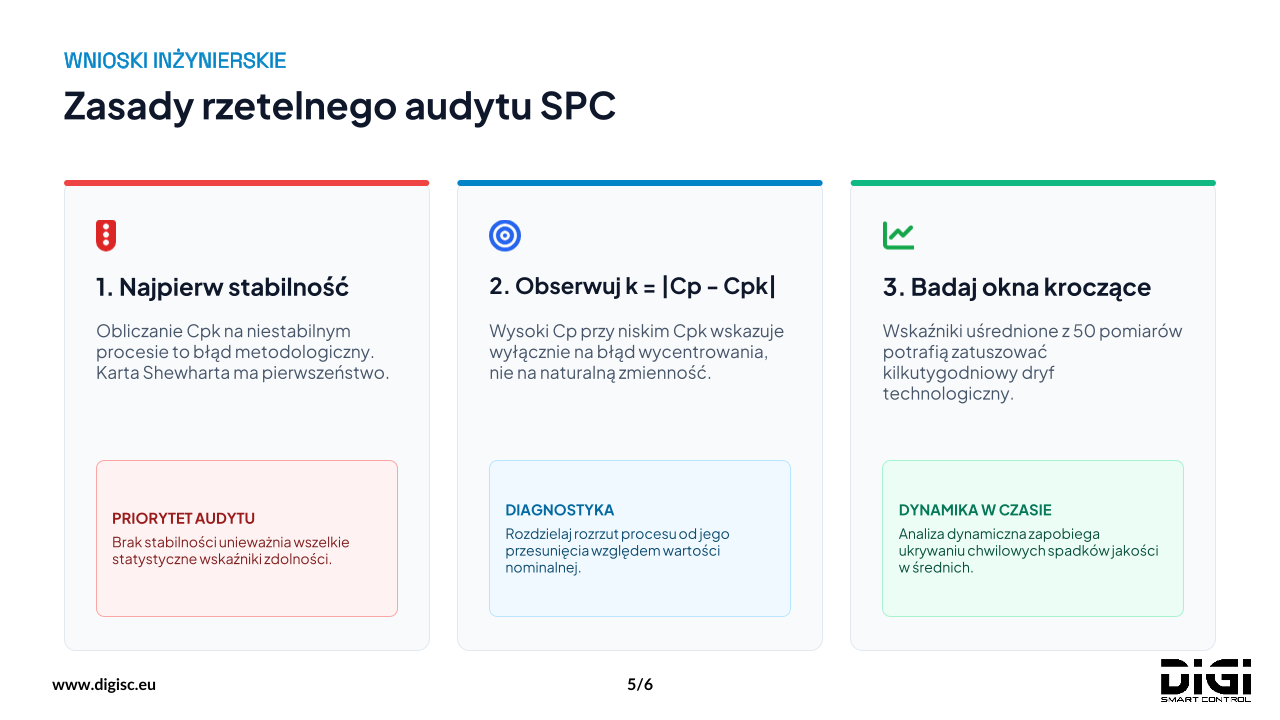
- Stability first. The Shewhart chart takes priority. Without stability, capability indices are meaningless.
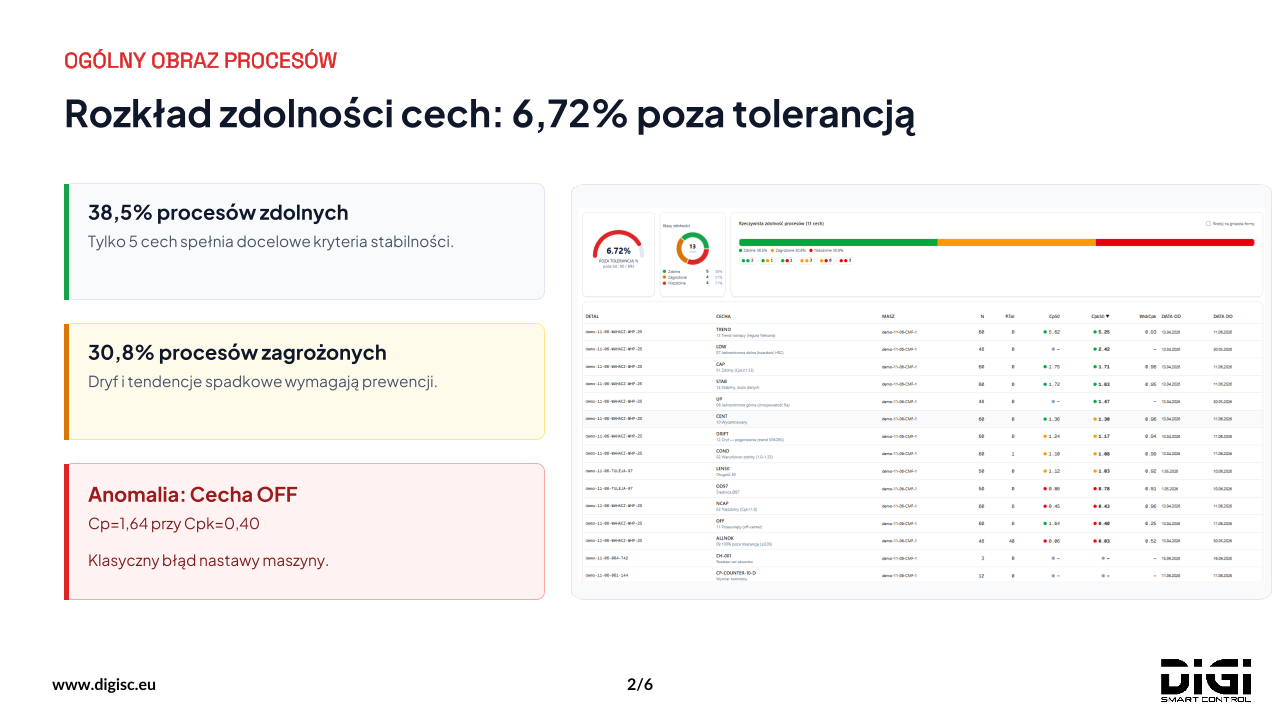
- Watch the gap between Cp and Cpk. A high Cp with a low Cpk means a poorly centred process, not too much spread. In the same data, characteristic OFF has Cp = 1.64 and Cpk = 0.40: a classic machine setting error.
- Examine rolling windows. An index averaged over a long period can hide a drift lasting several weeks.
Takeaway
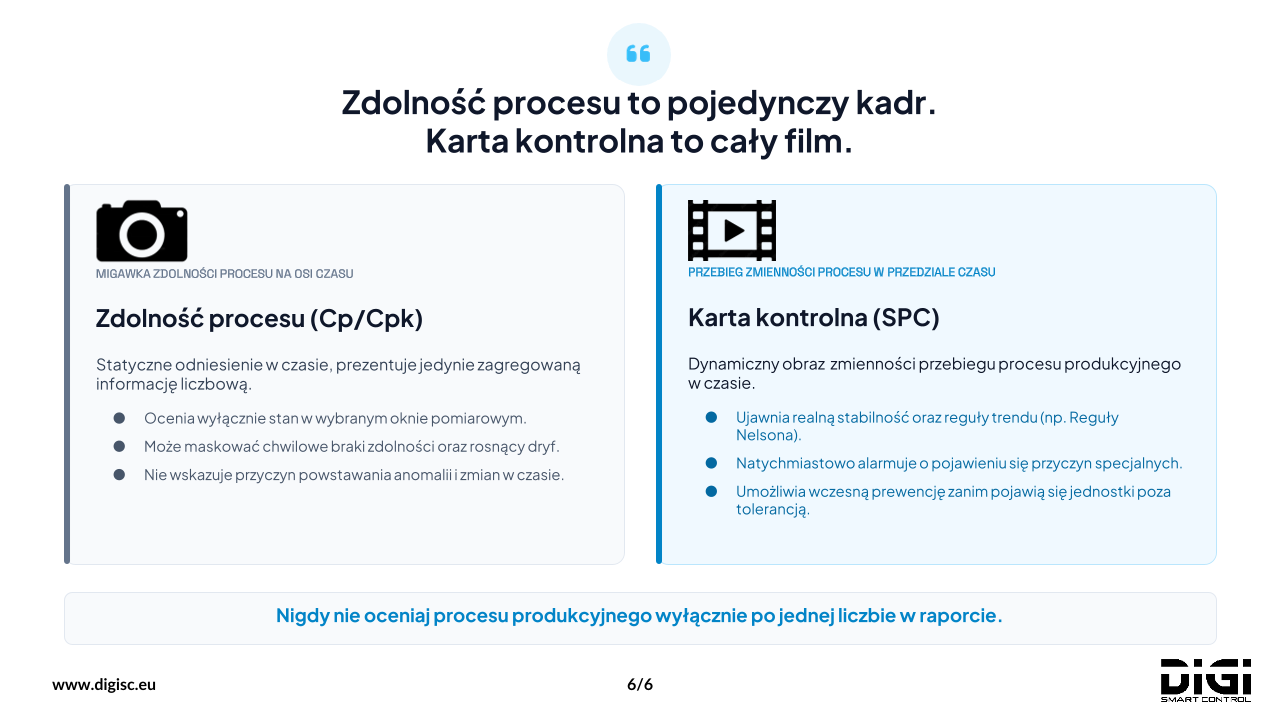
Cpk is only a snapshot of the process. Only the control chart and the trend over time show whether the process is really under control.
The data comes from a demo company; the screens on the slides are real DiGi Smart Control screens (in Polish).
Over to you
How do you handle this in your plant? Do operators react to Nelson rules, or only to a part out of tolerance?
Control charts and Nelson rules in DiGi Smart ControlRelated terms