
Glossary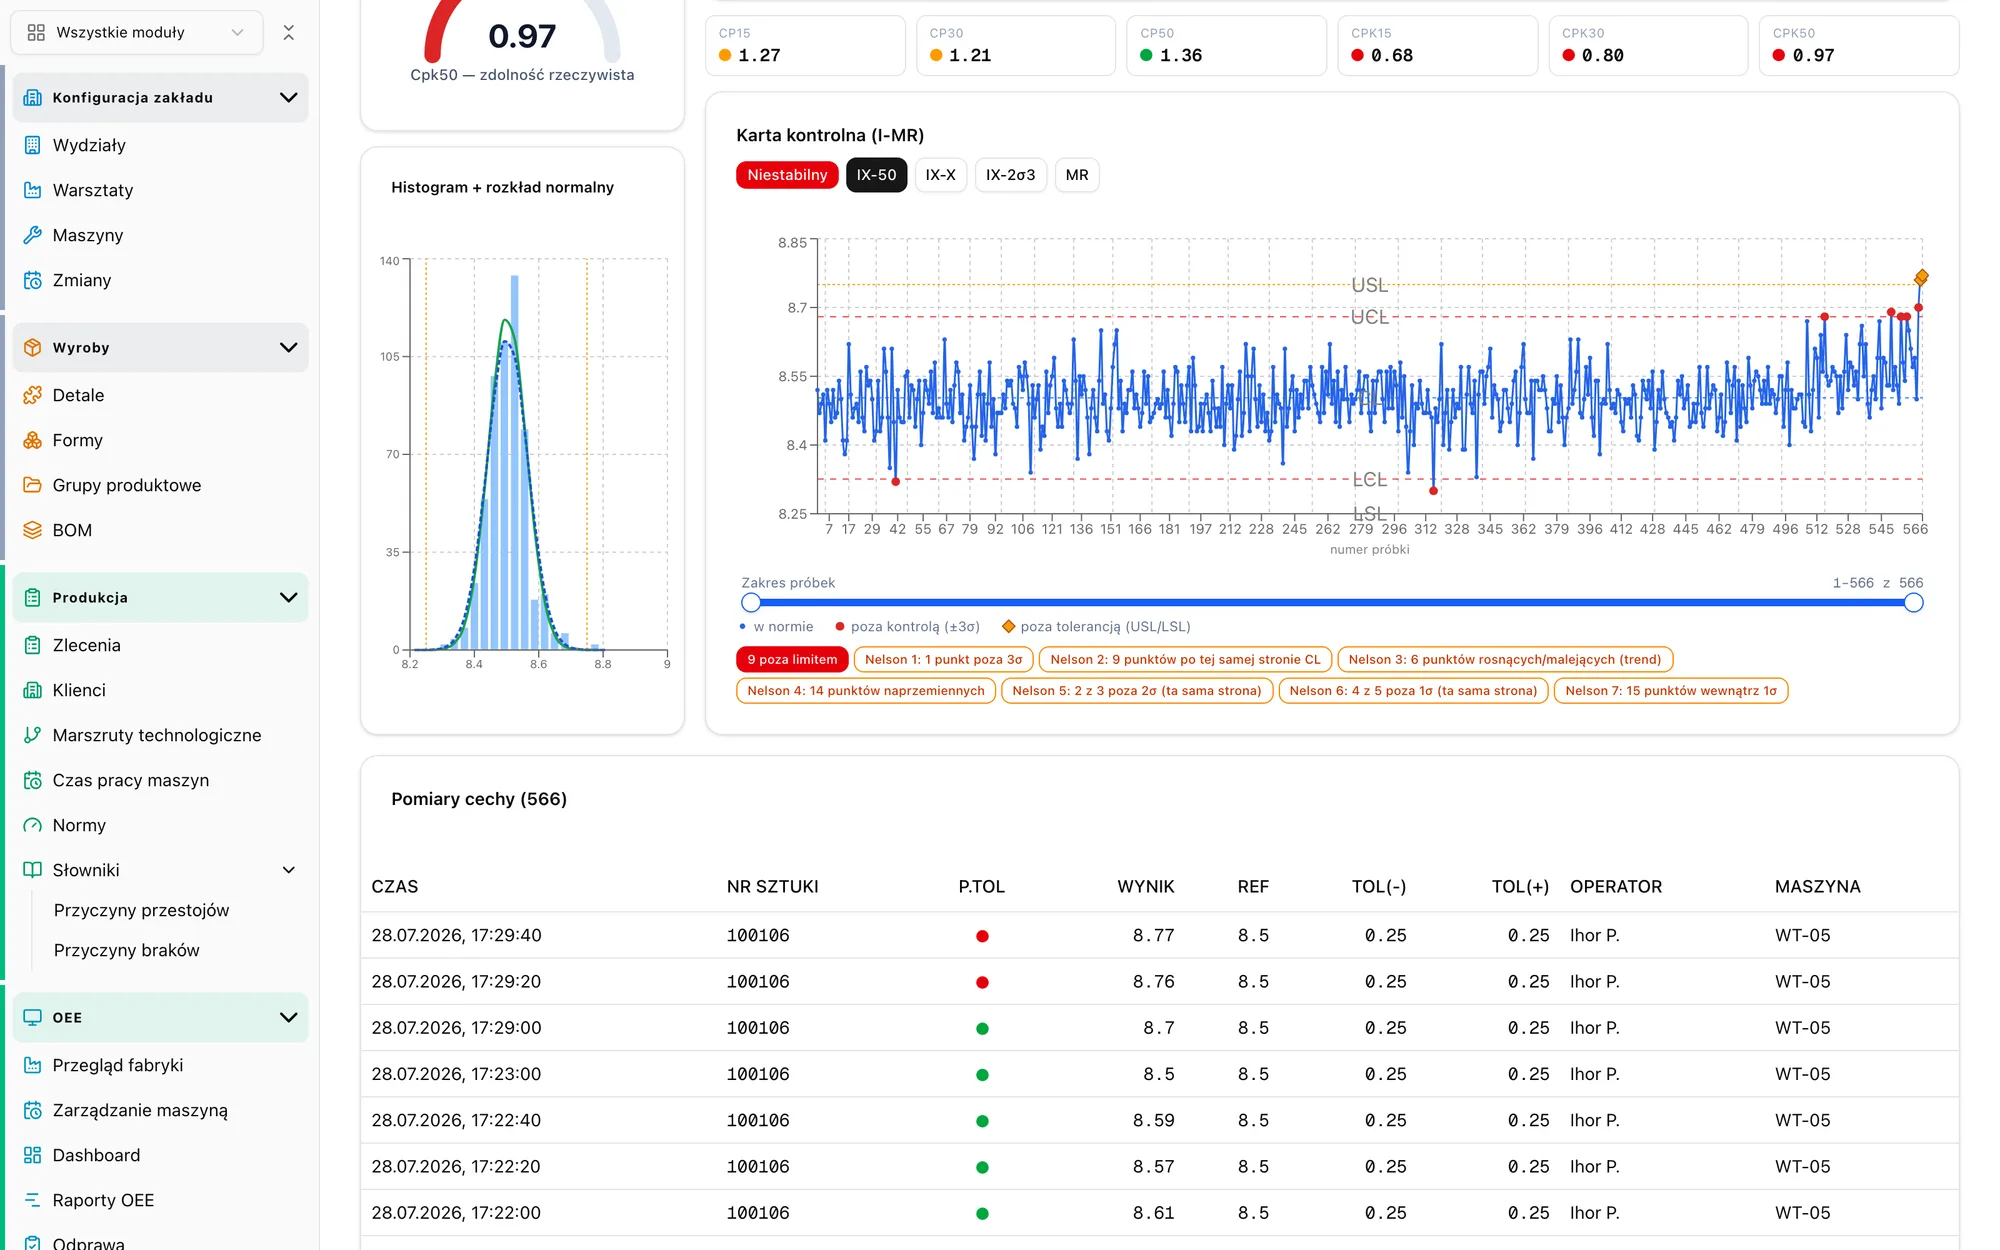 DiGi Smart Control
Control chart
Shewhart control chart
A plot of results over time with a centre line and control limits calculated from the process data.
Control limits are not the same as the tolerance. The tolerance says what the customer wants. Control limits say what the process does on its own.
The I-MR chart is for individual measurements. The X-bar/R chart is for subgroups, for example five pieces measured in one session.
What it looks like in the system
The chart type is picked automatically from the number of pieces per session set in the control plan.