A system for the shop floor
Production quality and efficiency in one system
Data enters the system straight from the machine and the gauges. The operator does everything on one tablet, and you see OEE, process capability and the history of every batch live.
- Readings straight from the gauge
- Pieces counted from the machine
- Everything on one operator tablet
Manufacturers that work with us




Does this sound familiar?
Three situations from the shop floor and what they look like after implementation.
Audit around the corner, documentation in chaos
You dig through drawers for paperwork. No change history. The auditor asks about something from three months ago.
Complete documentation in one click
Inspection history, who measured, with what and what the specification was at the time. All with date and time.
Quality controlDowntime, but why? Every shift says something different
The line is down. The electrician blames mechanics, mechanics blame material. Zero data.
Reasons recorded at the moment of the stop
When the machine stops, the operator picks a reason on the tablet. After a week you have a loss list ranked by lost hours.
Production efficiencyA complaint, and nobody knows where it came from
The batch left a month ago. You do not know which raw material it was made from or who inspected it.
From product to raw material in a minute
Open the batch and see the raw material, machine, shift and inspection results. Hold exactly as much as needed.
Batch traceabilityThree modules on one set of data
One implementation, one product register and one tablet handle quality, efficiency and batch traceability. You start with one module and switch the others on without a long implementation.
Quality control
DiGi Smart Control
The system reminds the operator about the inspection on the tablet, the reading comes straight from the gauge and is judged immediately, and the control chart warns about process drift before the first reject.
- No more paper inspection cards
- An alert on deviation at the moment of measurement
- Complete documentation for the auditor and the customer
- Inspection deadlines watched by the system, not by the operator's memory
Production efficiency
DiGi Smart Monitor
Pieces and run time are counted from the machine signal, on a stop the operator picks a reason on the tablet, and the manager gets the shift timeline, the loss list and a shift report by e-mail before the morning meeting.
- Live OEE of every machine
- Downtime reasons recorded at the moment of the event
- A loss list ranked by recoverable hours
- Shift report sent automatically by e-mail
Batch traceability
DiGi Smart Trace
A delivery gets a batch number and a label, the operator scans it at the machine, and on a complaint you see in a minute what a pallet was made from and which other pallets from the same delivery need to be held.
- From pallet to raw material in a minute
- Hold bad batches, not the whole warehouse
- A scan instead of retyping numbers
- Inspection results attached to the batch
Where the data comes from
The same path in every module
- 1
Machine and gauge
Cycle counter, run signal, scale, caliper. Data enters the system without retyping.
- 2
Operator
One tablet: production, downtime reason, quality inspection, batch.
- 3
Office
OEE, process capability and batch history on the same data.
See the whole flow before you talk to us
Three click-through demos on the live system, one per module. Pick what you want to see.
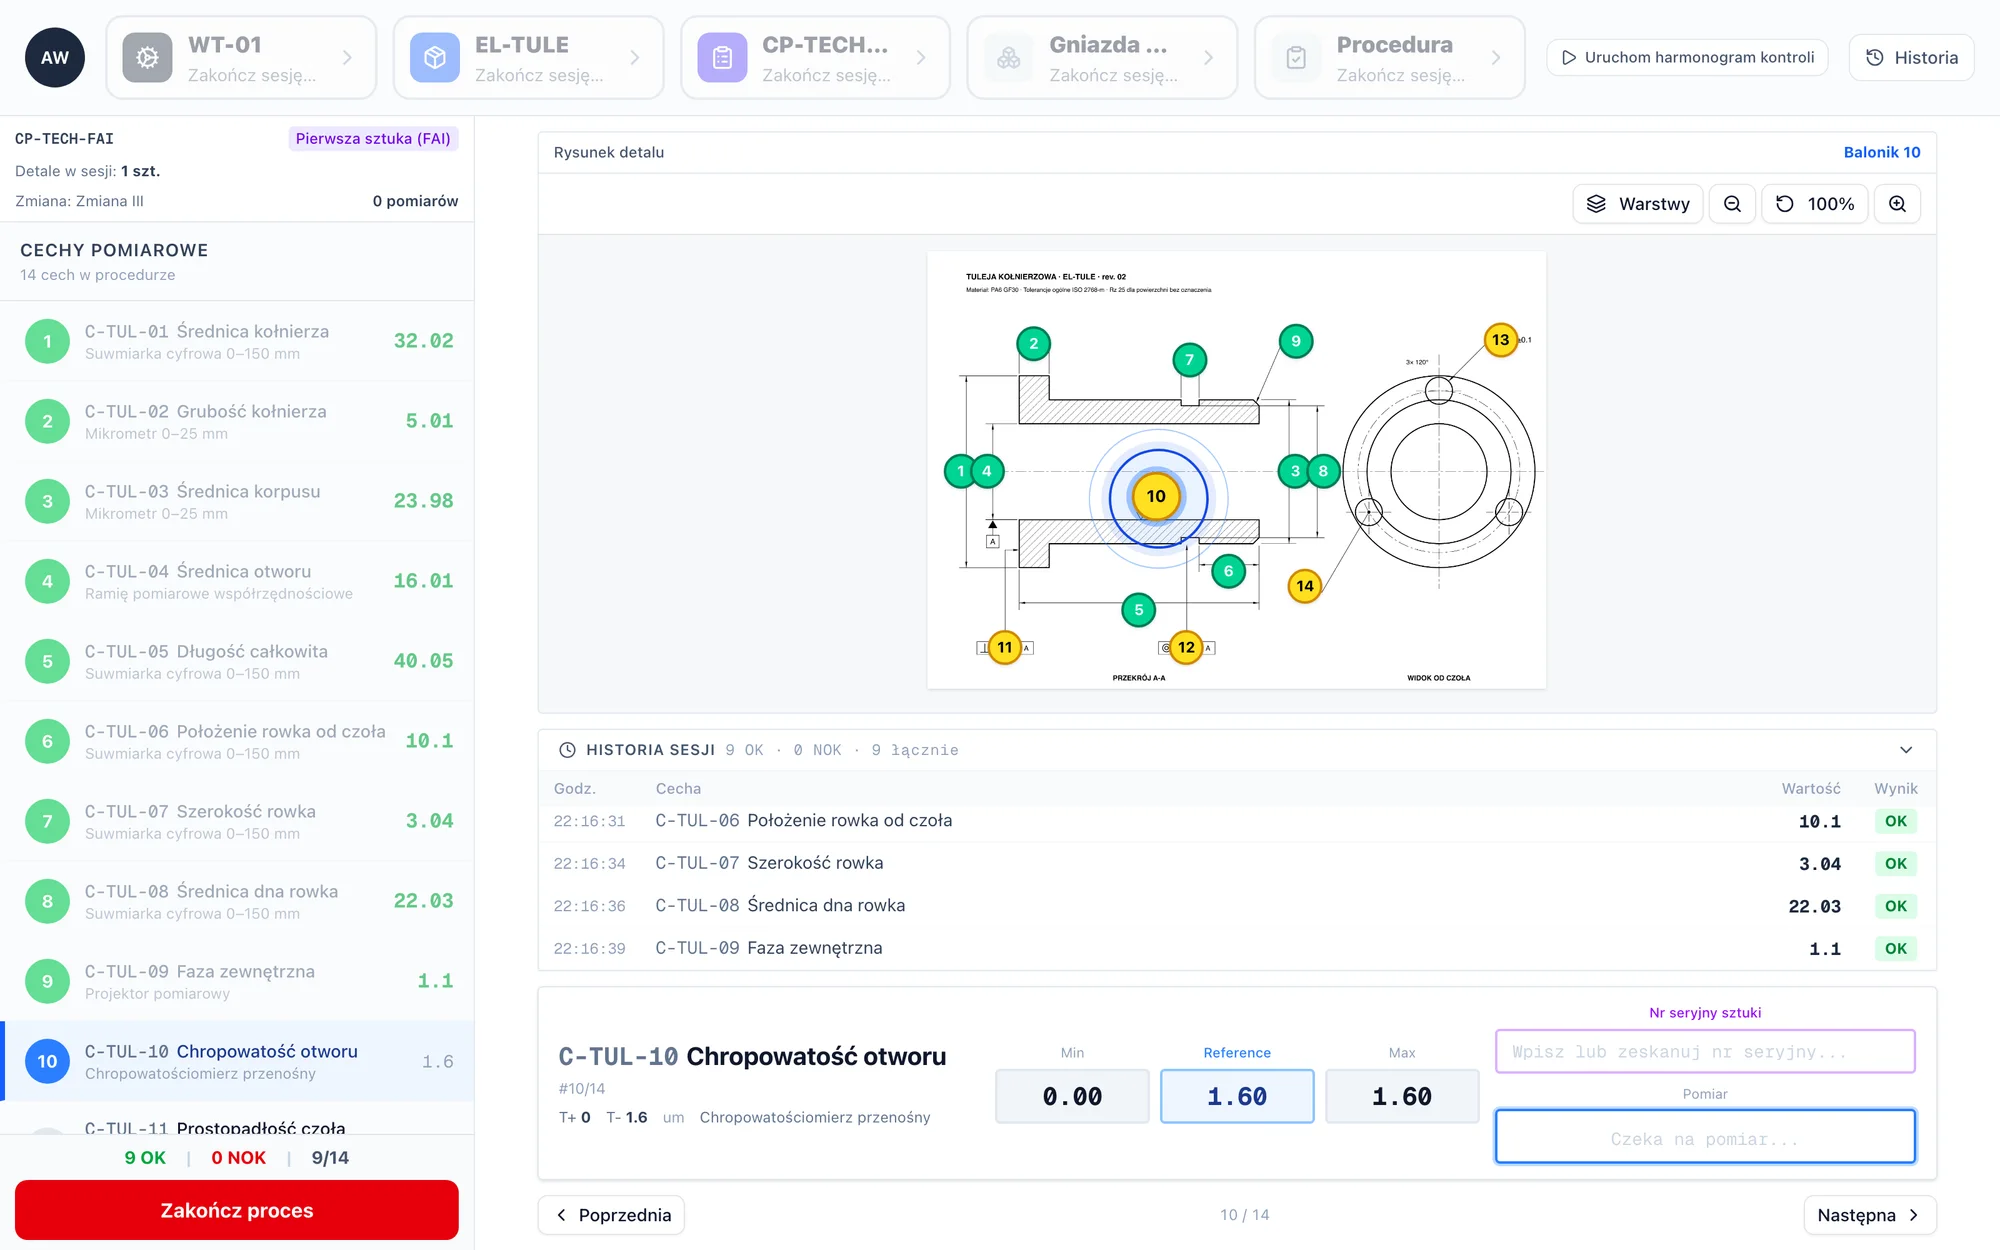
From the drawing to the signal that the process is drifting
On the live system, on the example of a flanged bushing with a drawing and a moulded cup. The click-through demo walks you through these four stages:
- 01The technologist uploads the drawing and sets up a control plan
- 02The operator measures with a scale and a caliper
- 03Out of tolerance: defect and cause
- 04Control chart and process capability in the panel
Everyone sees what they need
The same data, four perspectives.
- Did the inspection really happen? The system watches the inspection moment and counts done versus planned.
- Where is the problem? Capability board: every characteristic with a colour, Cp and Cpk, machine and cavity ranking.
- Will we react in time? A signal from the control chart before the first reject.
- What do I show the auditor and the customer? The history of every measurement: who, when, with what, against which specification.
- How much time does paper eat? No more retyping cards into a spreadsheet.
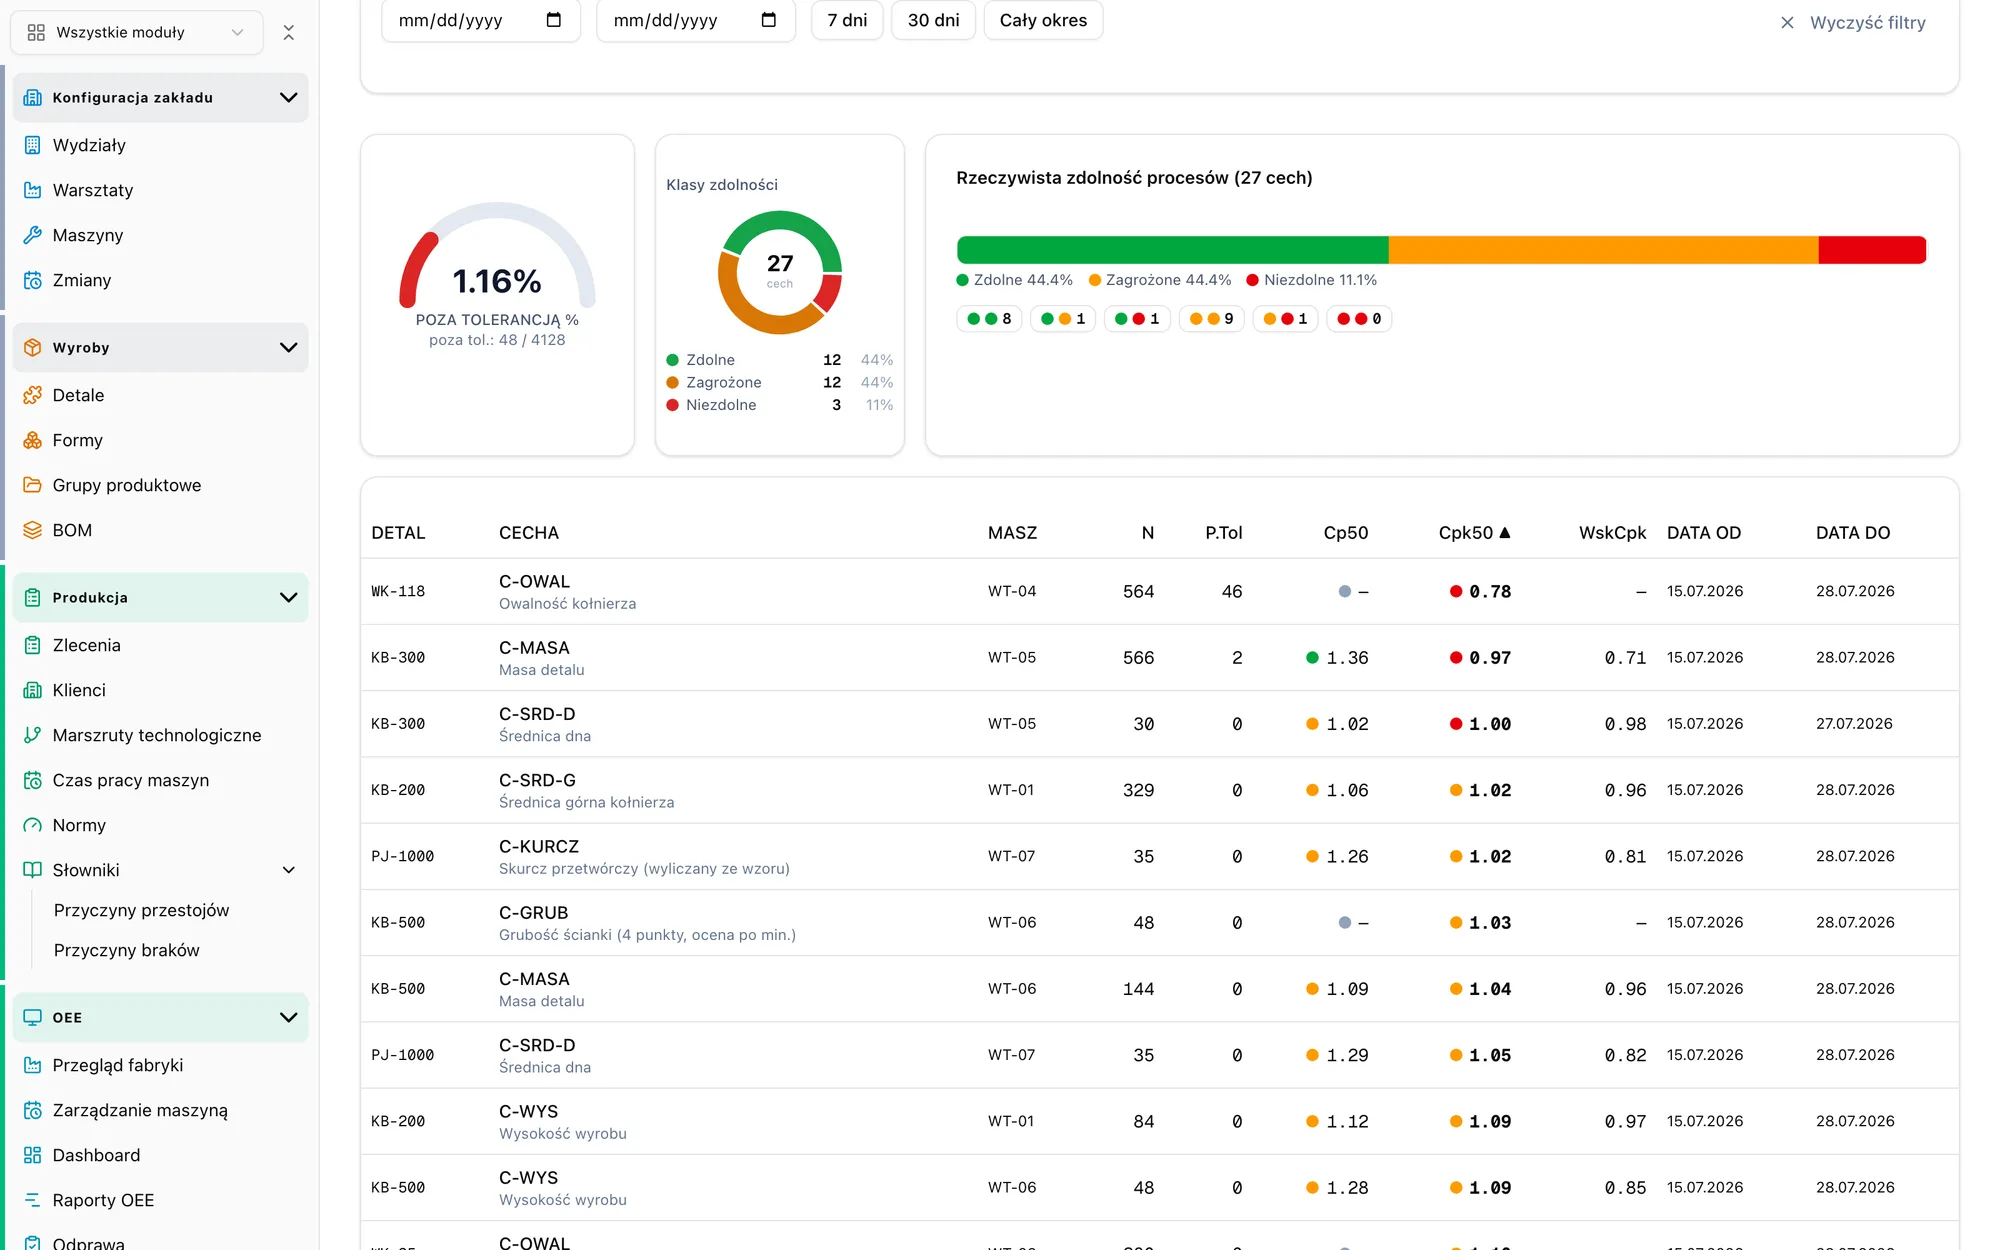
Ready for the audit, the complaint and the IT department's questions
Quality, batches and efficiency are calculated on one set of data you can account for in front of the auditor, the customer and management. The plant earns the certificate, the system provides the evidence.
Evidence for the audit and the complaint
- Auditor
- The history of every measurement: who, when, with what and against which specification. Control plan, gauge supervision, non-conformance and action workflow. Evidence on the spot, not in binders.
- Customer
- A complaint settled on batch numbers: from the pallet to the raw material delivery and back. Capability reports and inspection results ready to send the same day.
- Management
- One OEE definition for all machines: planned time from the plant calendar, pieces from the machine, corrections with an author. Numbers nobody questions at the meeting.
- Standards
- The plant works to its own standard: ISO 9001, IATF 16949, customer requirements, FAI or 8D. The system imposes none, it just keeps the data so that every audit has evidence.
IT department questions
Where is the data stored?
In the cloud or on a server in your network. The system runs in a browser, nothing is installed on the workstations.
Who has access to what?
Roles with permissions per area: operator, leader, manager. Only those who should can change data.
Who changed what?
Every correction has an author and a time, and nobody edits the raw machine signal.
How do you connect machines and gauges?
Machines through a gateway from the controller or a sensor, without touching the program. Gauges by cable or Bluetooth, straight in the browser.
Will it connect to our ERP?
Orders and parts come in from your system, confirmations and inspection results go back. API, files or database views.
Can we get our data out?
Every report to PDF and spreadsheet, the measurement and event history too. No closed format.
Connect what you already have
You do not replace your machines or gauges. The system takes data from what is on the floor today.
Measuring gauges
Calipers, micrometers, scales and indicators with a data output. By cable or Bluetooth, straight in the browser on the tablet.
No drivers installed on the workstation
Machines
The run signal and cycle counter from the controller or an added sensor. A gateway collects the data and sends it to the system.
No changes to the machine program
ERP and MES
Parts and orders come from your system, and confirmations and inspection results go back. No more double entry.
API, files or a database
Four steps, without stopping production
We start with one machine or one workstation. You have the first data from the floor after two weeks.
- Step 1
Needs analysis
We agree what we measure and which workstation we start with. One meeting, usually online.
- Step 2
Pilot on one machine
We launch the system on the chosen workstation, alongside production. We train operators and leaders.
- Step 3
Adjustments on data
After two or three weeks we review the pilot data and refine dictionaries, plans and reports.
- Step 4
Scaling
More machines and lines join gradually. You add machine and ERP integration when you decide.
Smart Monitor pilot on one machine: 5,000 PLN
Launch, configuration, training. The first data from the floor after two weeks, without stopping production.
See the system on your own example
We reply within 24 hours

Piotr will help you pick the solution that fits your production processes.
Phone: (+48) 668 211 736
Email: digismartcontrol@gmail.com