
Production efficiency
Every machine and its result live. A reaction in minutes, not the next day.
DiGi Smart Monitor counts pieces and run time straight from the machine, and the operator only describes the downtime reason. The manager gets the loss waterfall, a priority list and a ready morning meeting at six.
Price: 200 PLN per month per workstationSee pricing
How does DiGi Smart Monitor work?
From the machine signal, through the downtime reason, to an alert and a report at the manager. Click a step or wait, the animation advances automatically.
Manufacturers that work with us




Does this sound familiar?
The line is down, and every shift says something different
The electrician blames mechanics, mechanics blame material. Without reasons recorded at the moment of the stop there is no analysis at all.
Counters retyped from paper
The shift report is written afterwards, from memory. Arguments about how many really came out take more time than the improvement.
Management asks about OEE, and you guess
You know something is off, but you have no numbers. You cannot tell whether capacity is missing or time just leaks on changeovers.
What it looks like in practice
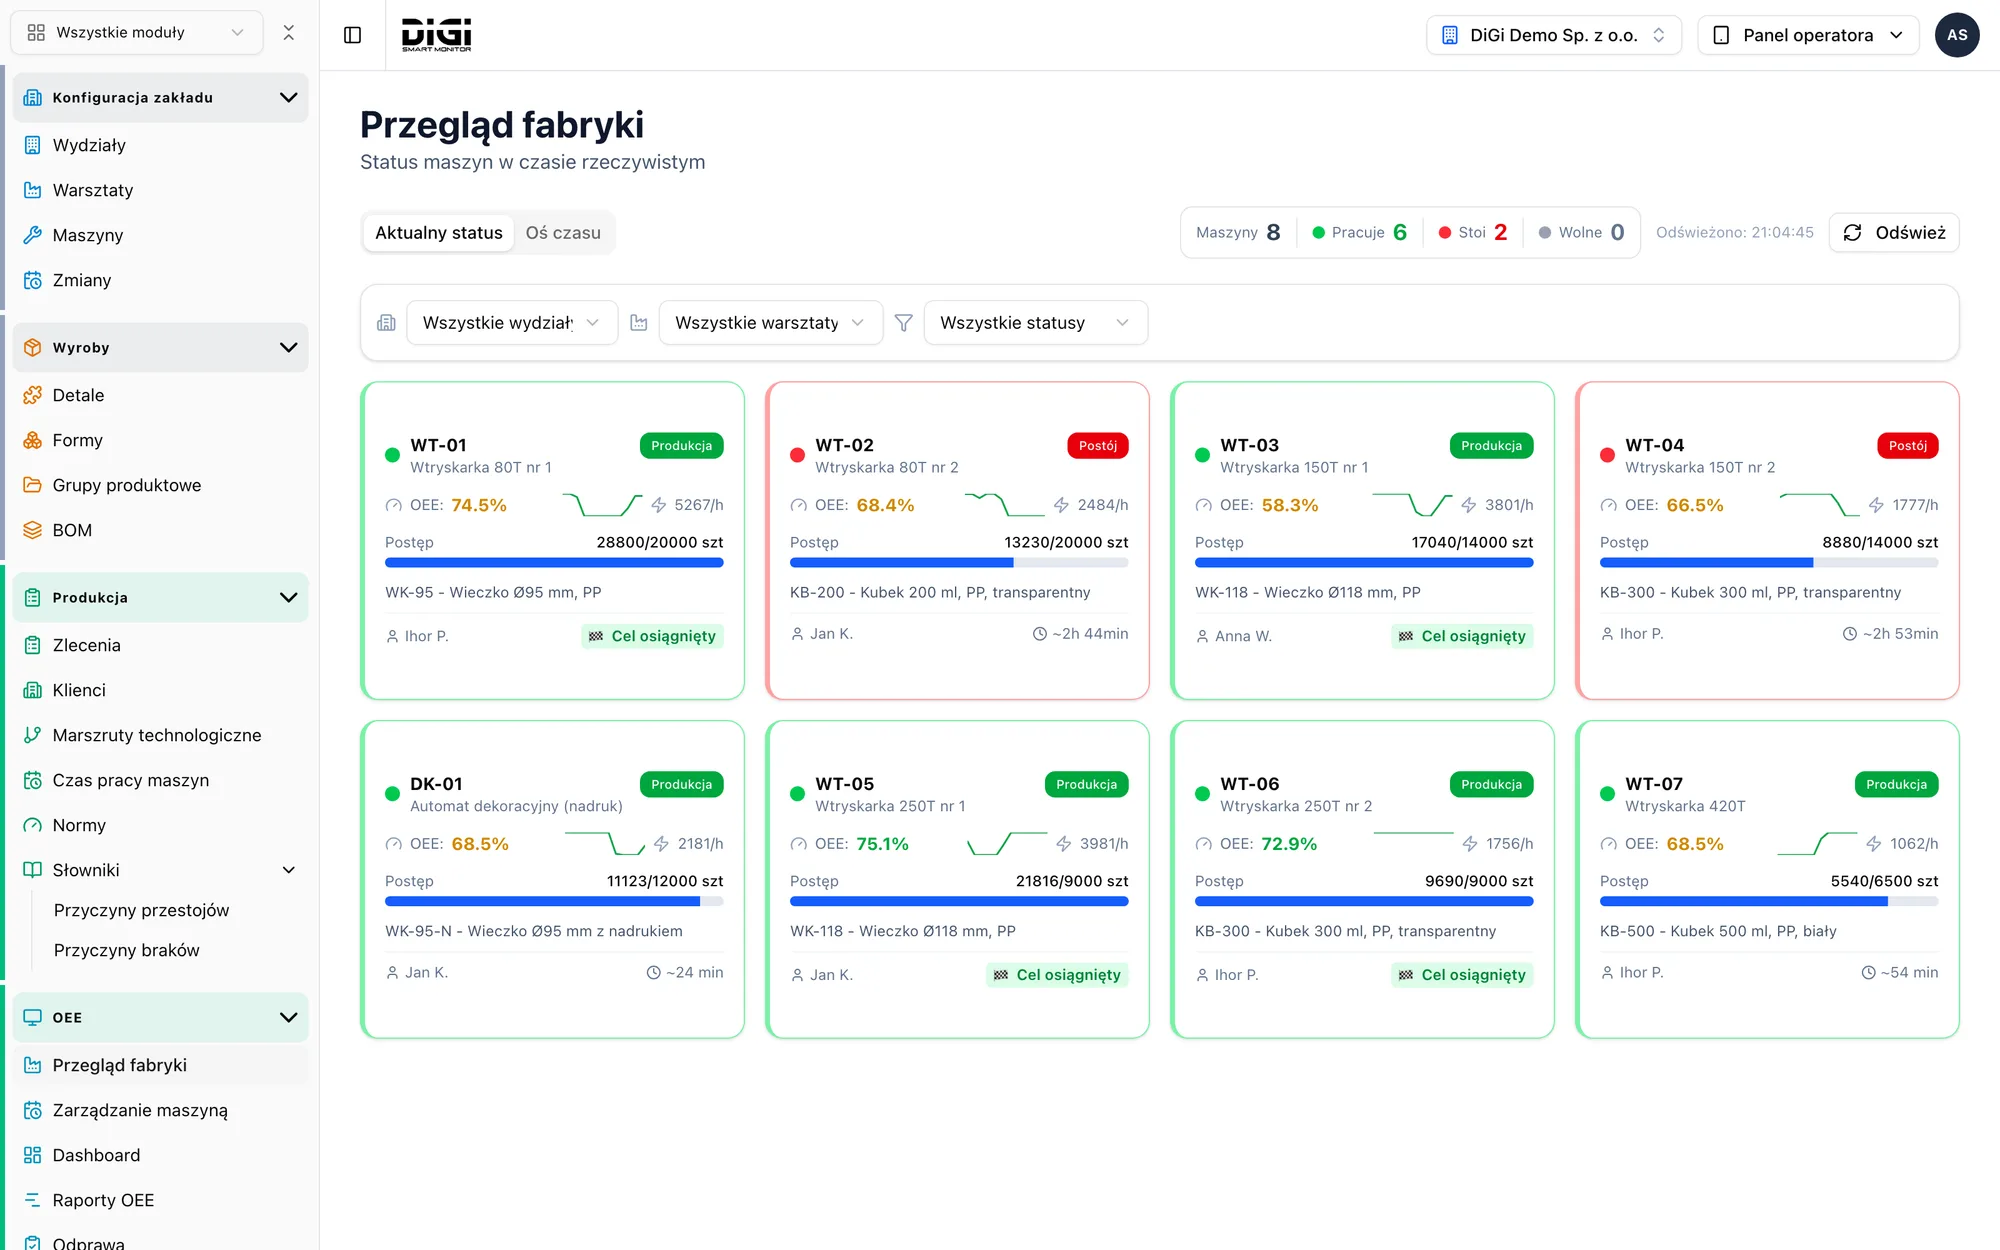
From the machine signal to the decision what to fix first, on system screens.
The machine counts the pieces, not a sheet of paper
The cycle signal from the controller or a sensor reaches the system through a gateway. The machine is counted even when nobody is logged in. You can also start without integration: the operator records events on the tablet.
No more retyping counters and arguing about how many really came out.
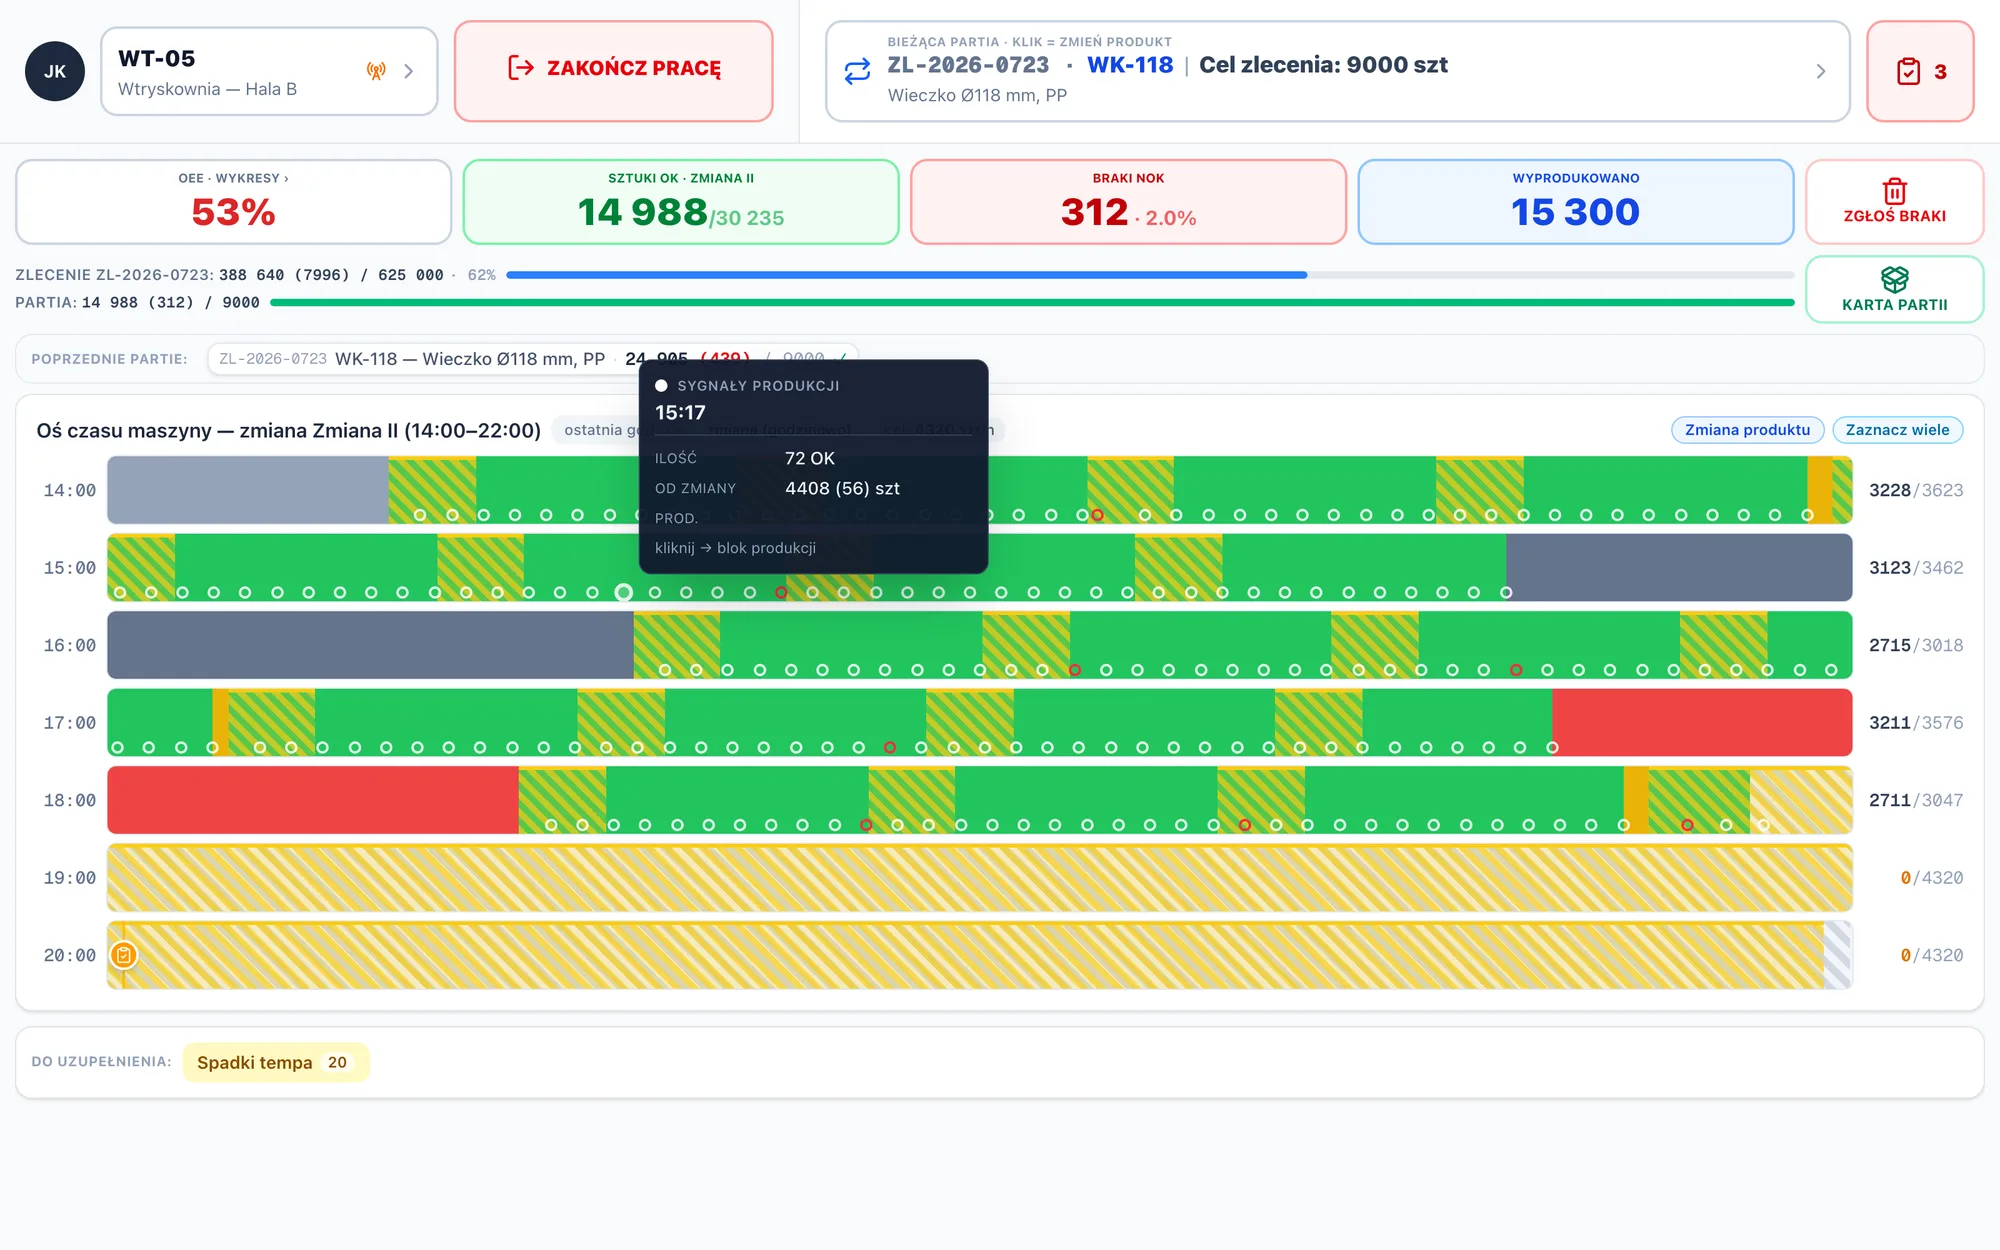
A downtime reason in three seconds
The machine stops, the tablet asks why. The operator picks a reason from a few big buttons. They can also report a stop later or split it into several reasons.
The operator really describes stops, because it costs them nothing.
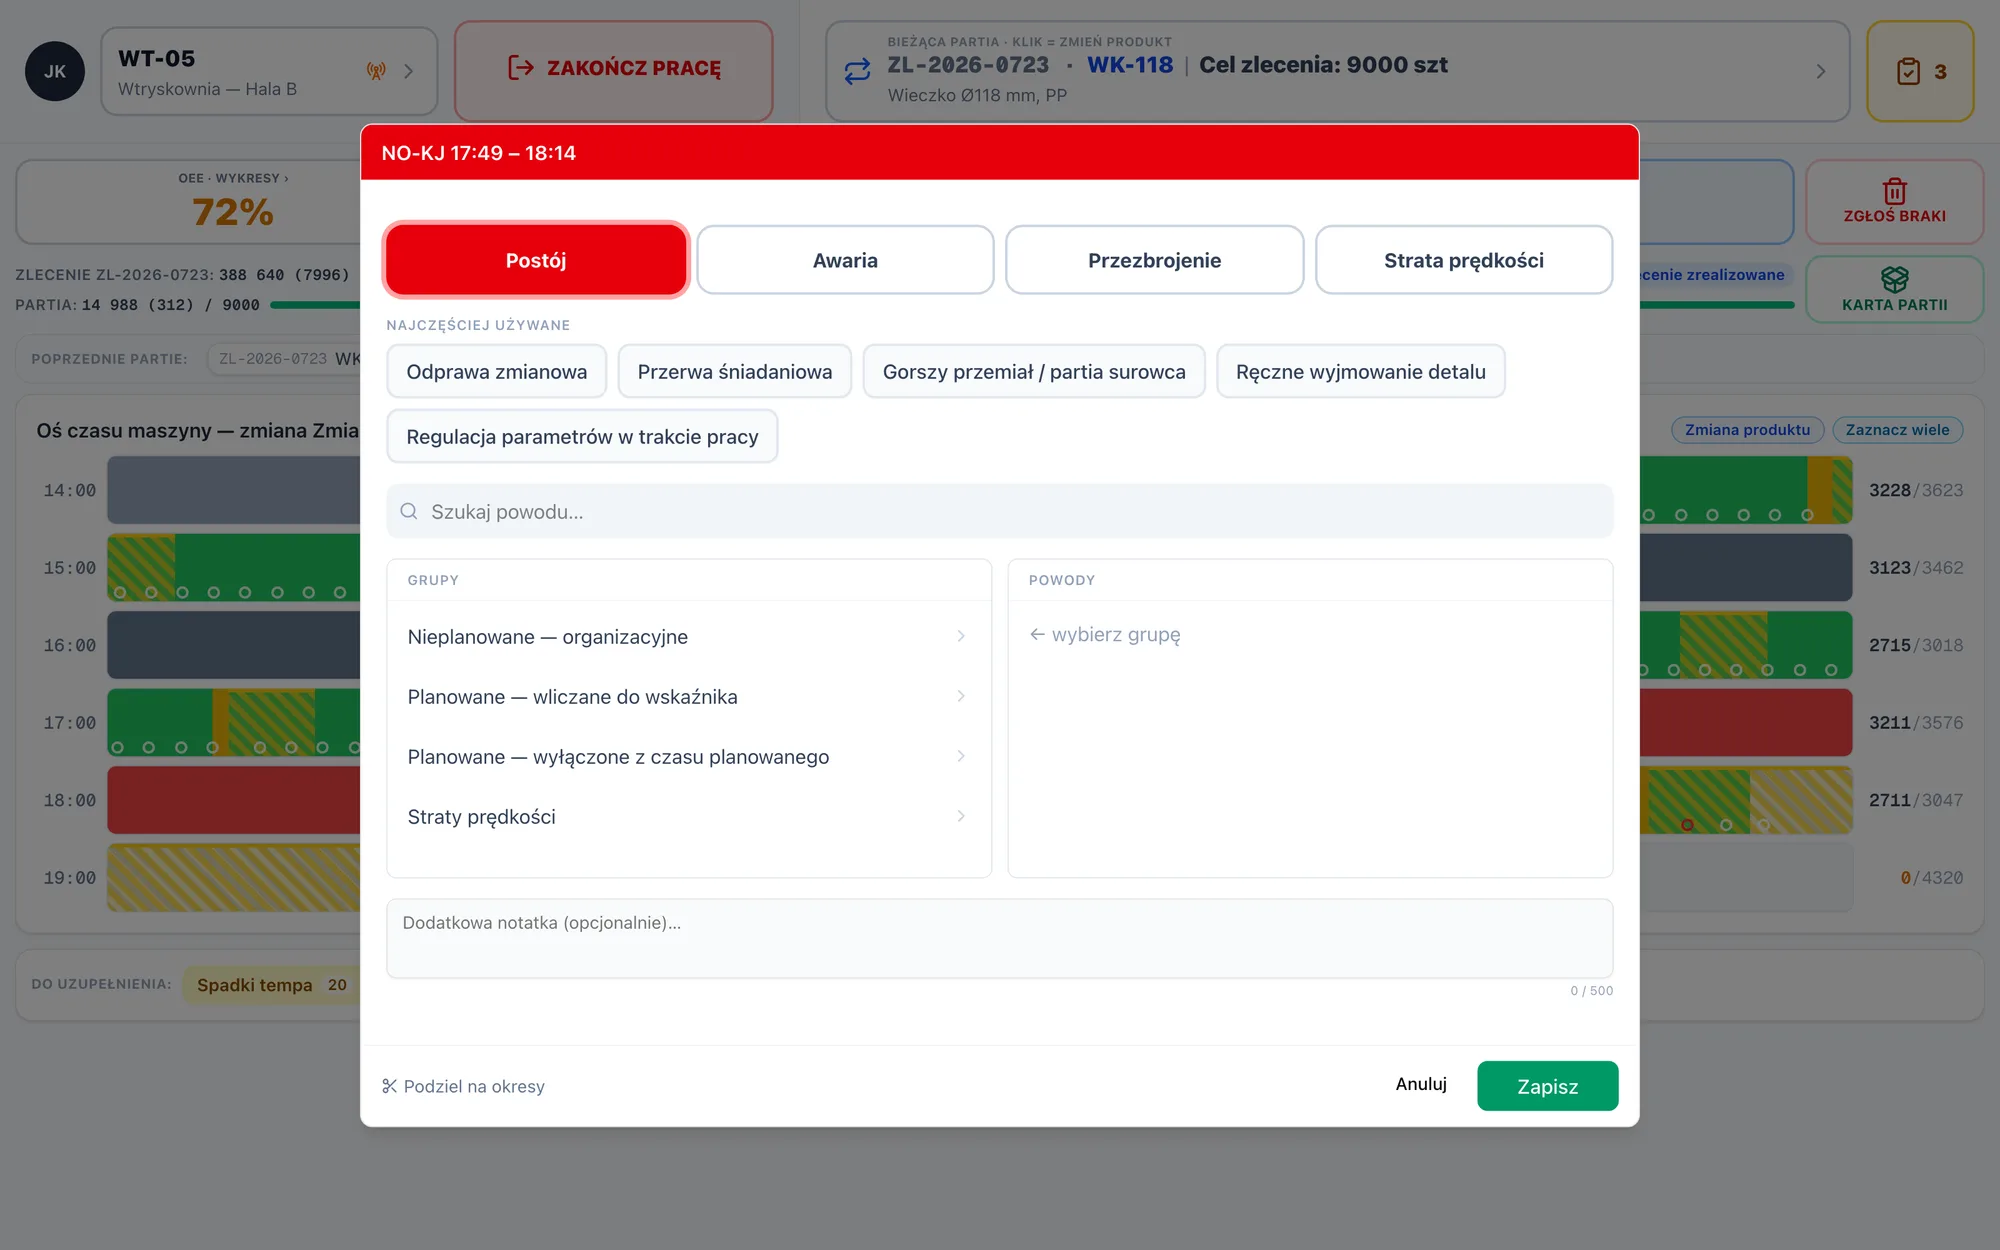
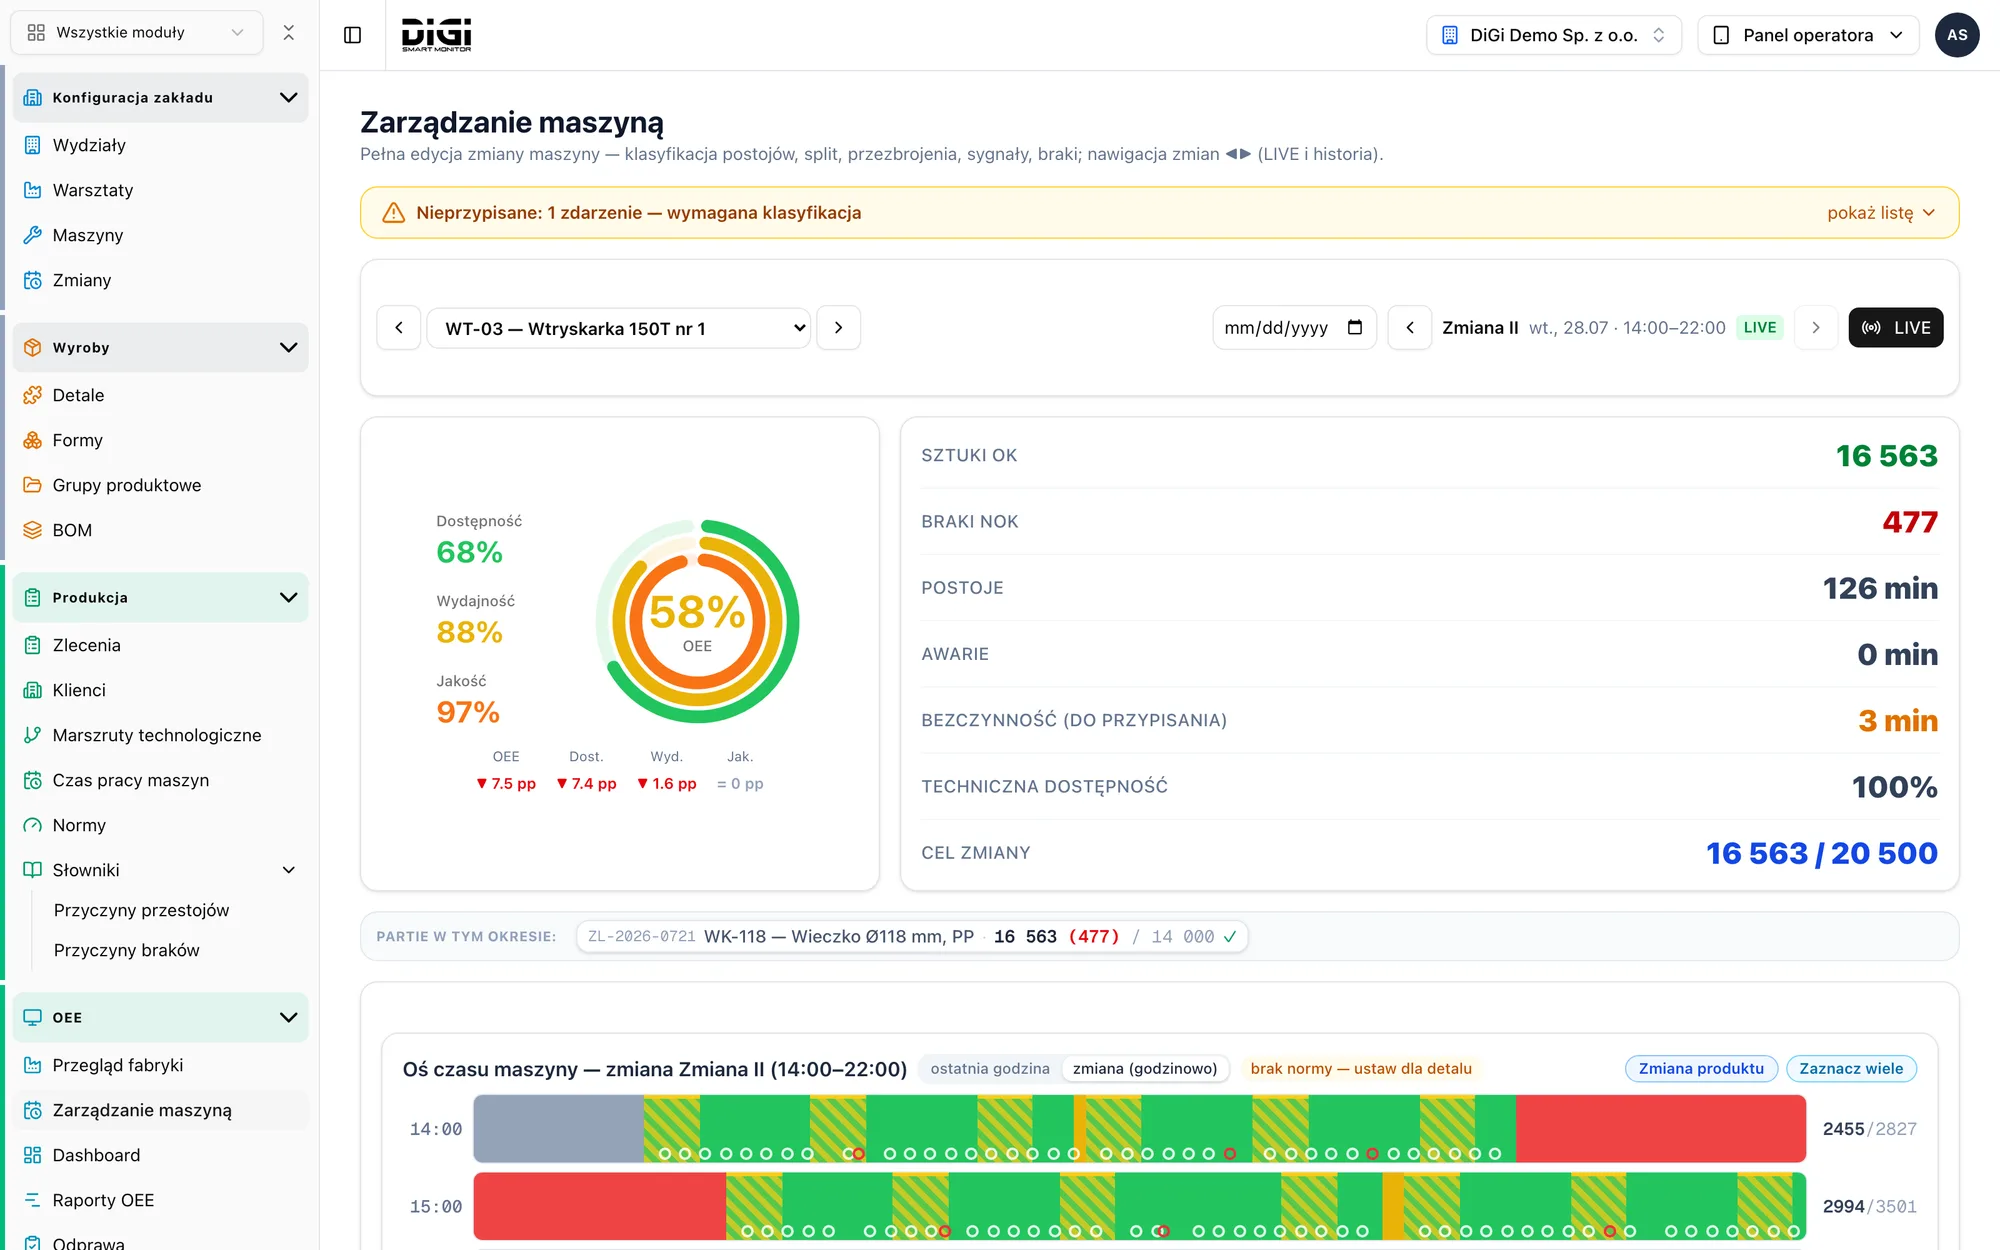
The whole shift minute by minute
The timeline of every machine: production, changeovers, stops, breakdowns. You see causes shared by several machines that a table would never show.
One screen replaces the shift report.
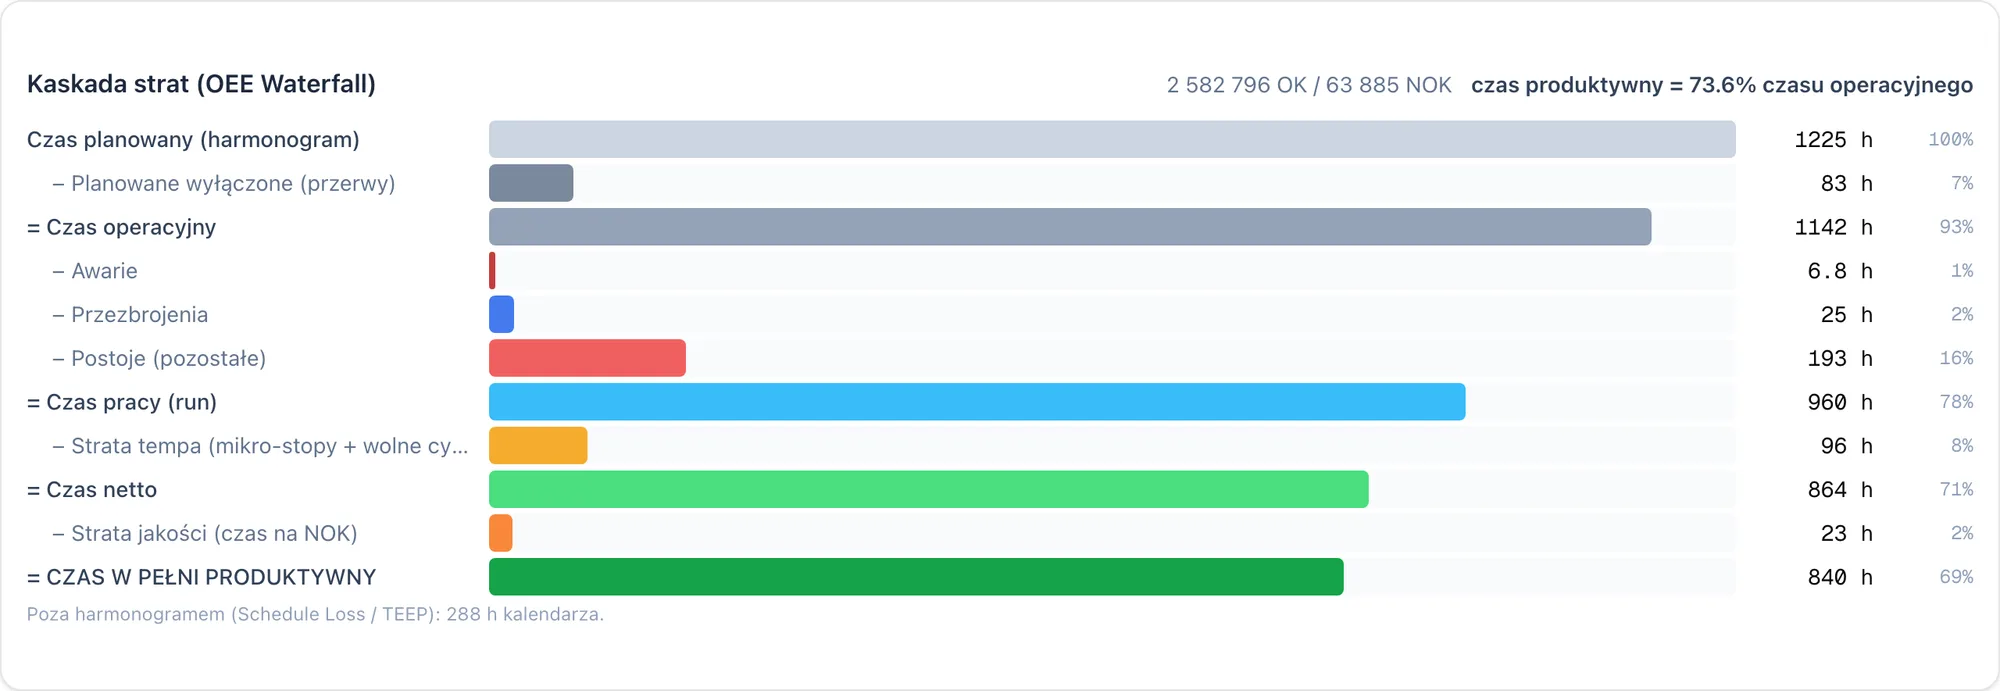
You see where time leaks
The loss waterfall breaks planned time into availability, performance and quality. The list of the biggest losses is ranked by recoverable hours.
The conversation stops being about an indicator and starts being about specific hours.
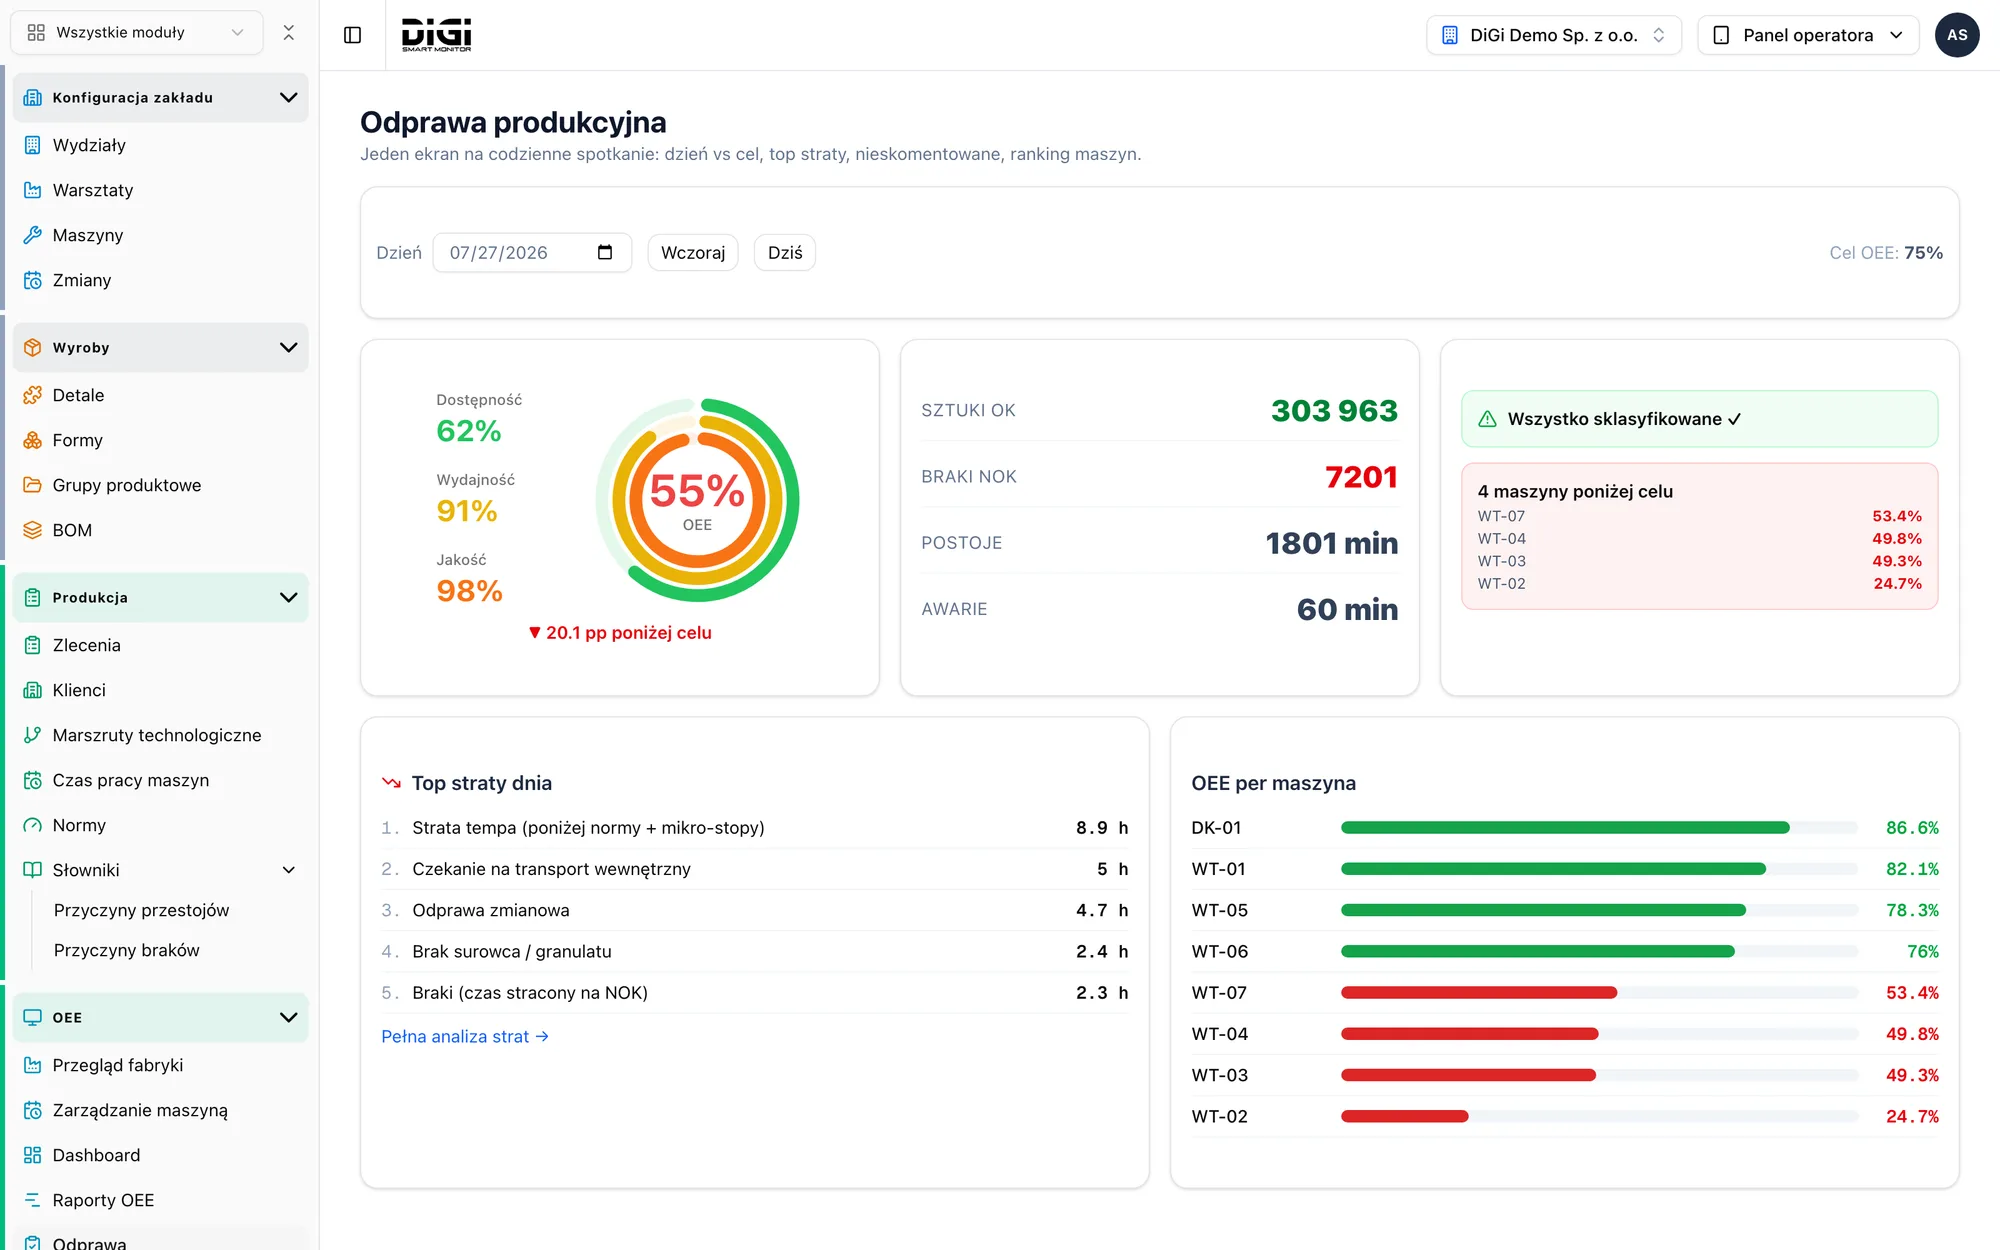
The morning meeting ready at six
The previous day's result, the biggest losses, open items. The shift, daily and weekly report arrives by e-mail with an attachment, without logging into the system.
Fifteen minutes of specifics instead of an hour of discussing impressions.
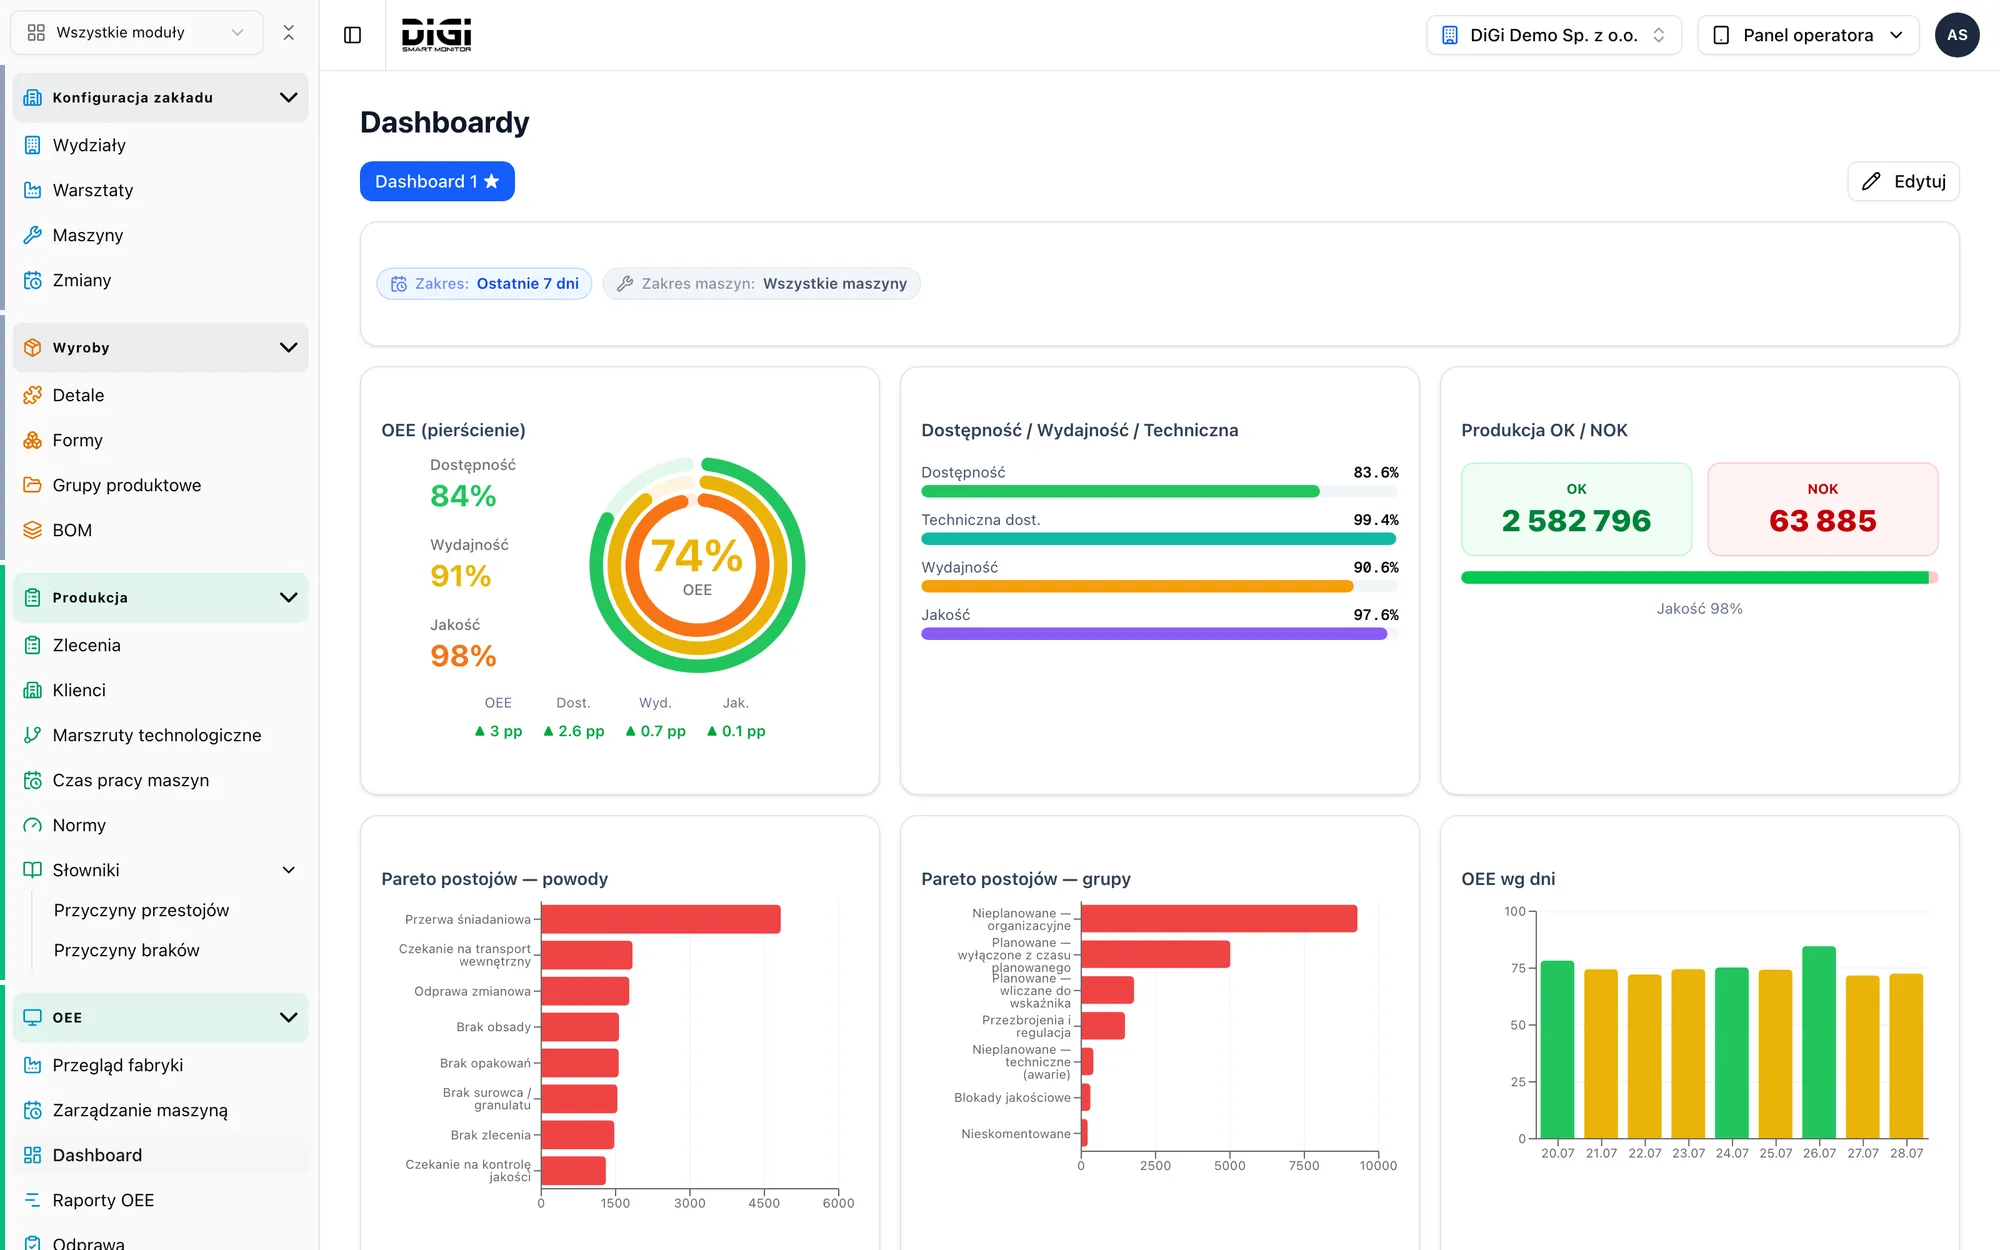
How much capacity is idle
OEE, OOE and TEEP side by side, MTBF and MTTR for every machine, changeover variance against plan, shift start delays.
The decision about the next machine is made on numbers, not on a hunch.
What sets DiGi Smart Monitor apart
Machine data without touching the controller, rate losses usually nobody counts, correct piece counts with disabled mould cavities and reports in any breakdown.
Connecting machines
Three ways to get data from a machine
- 1
Machine controller
The run signal and cycle counter are read from the machine controller through the DiGi gateway, without touching the machine program.
- 2
Added sensor
When the machine has no controller with communication, a cycle sensor and a small input module are enough. We do not touch the machine program.
- 3
Operator tablet
No integration at all: the operator records start, stops and pieces. A good way to start a pilot.
Rate losses
A slower cycle is a loss nobody counts
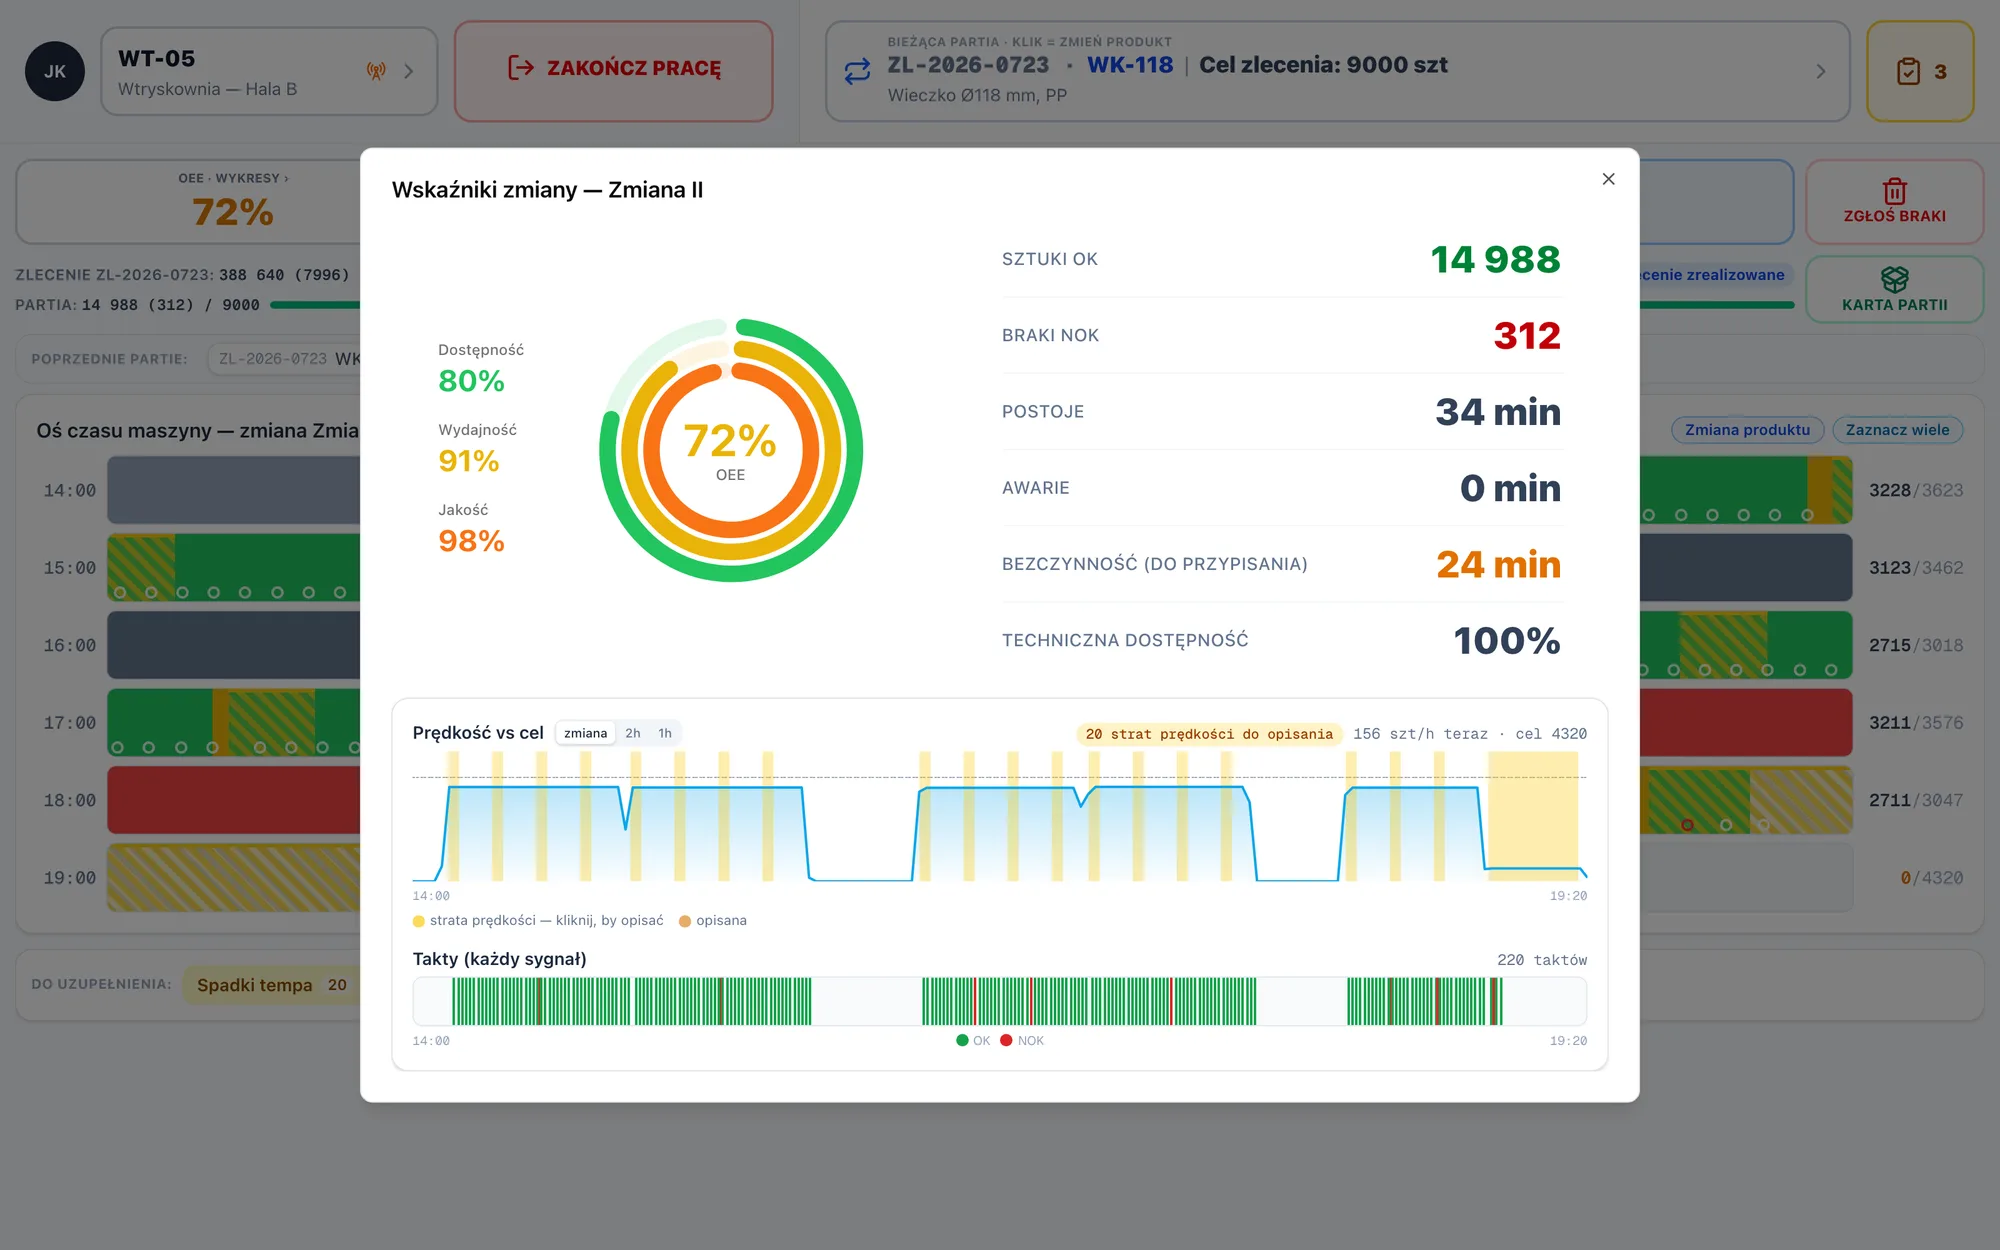
The machine runs, but slower than the standard, and you cannot see that in a paper report. The system compares speed with the target cycle by cycle, marks micro-stops and rate drops to describe, and every piece from the machine has its own signal.
On the loss list the rate often comes first, ahead of breakdowns. Only then do you know where time really leaks.
Moulds and cavities
Pieces add up even when the mould runs on part of its cavities
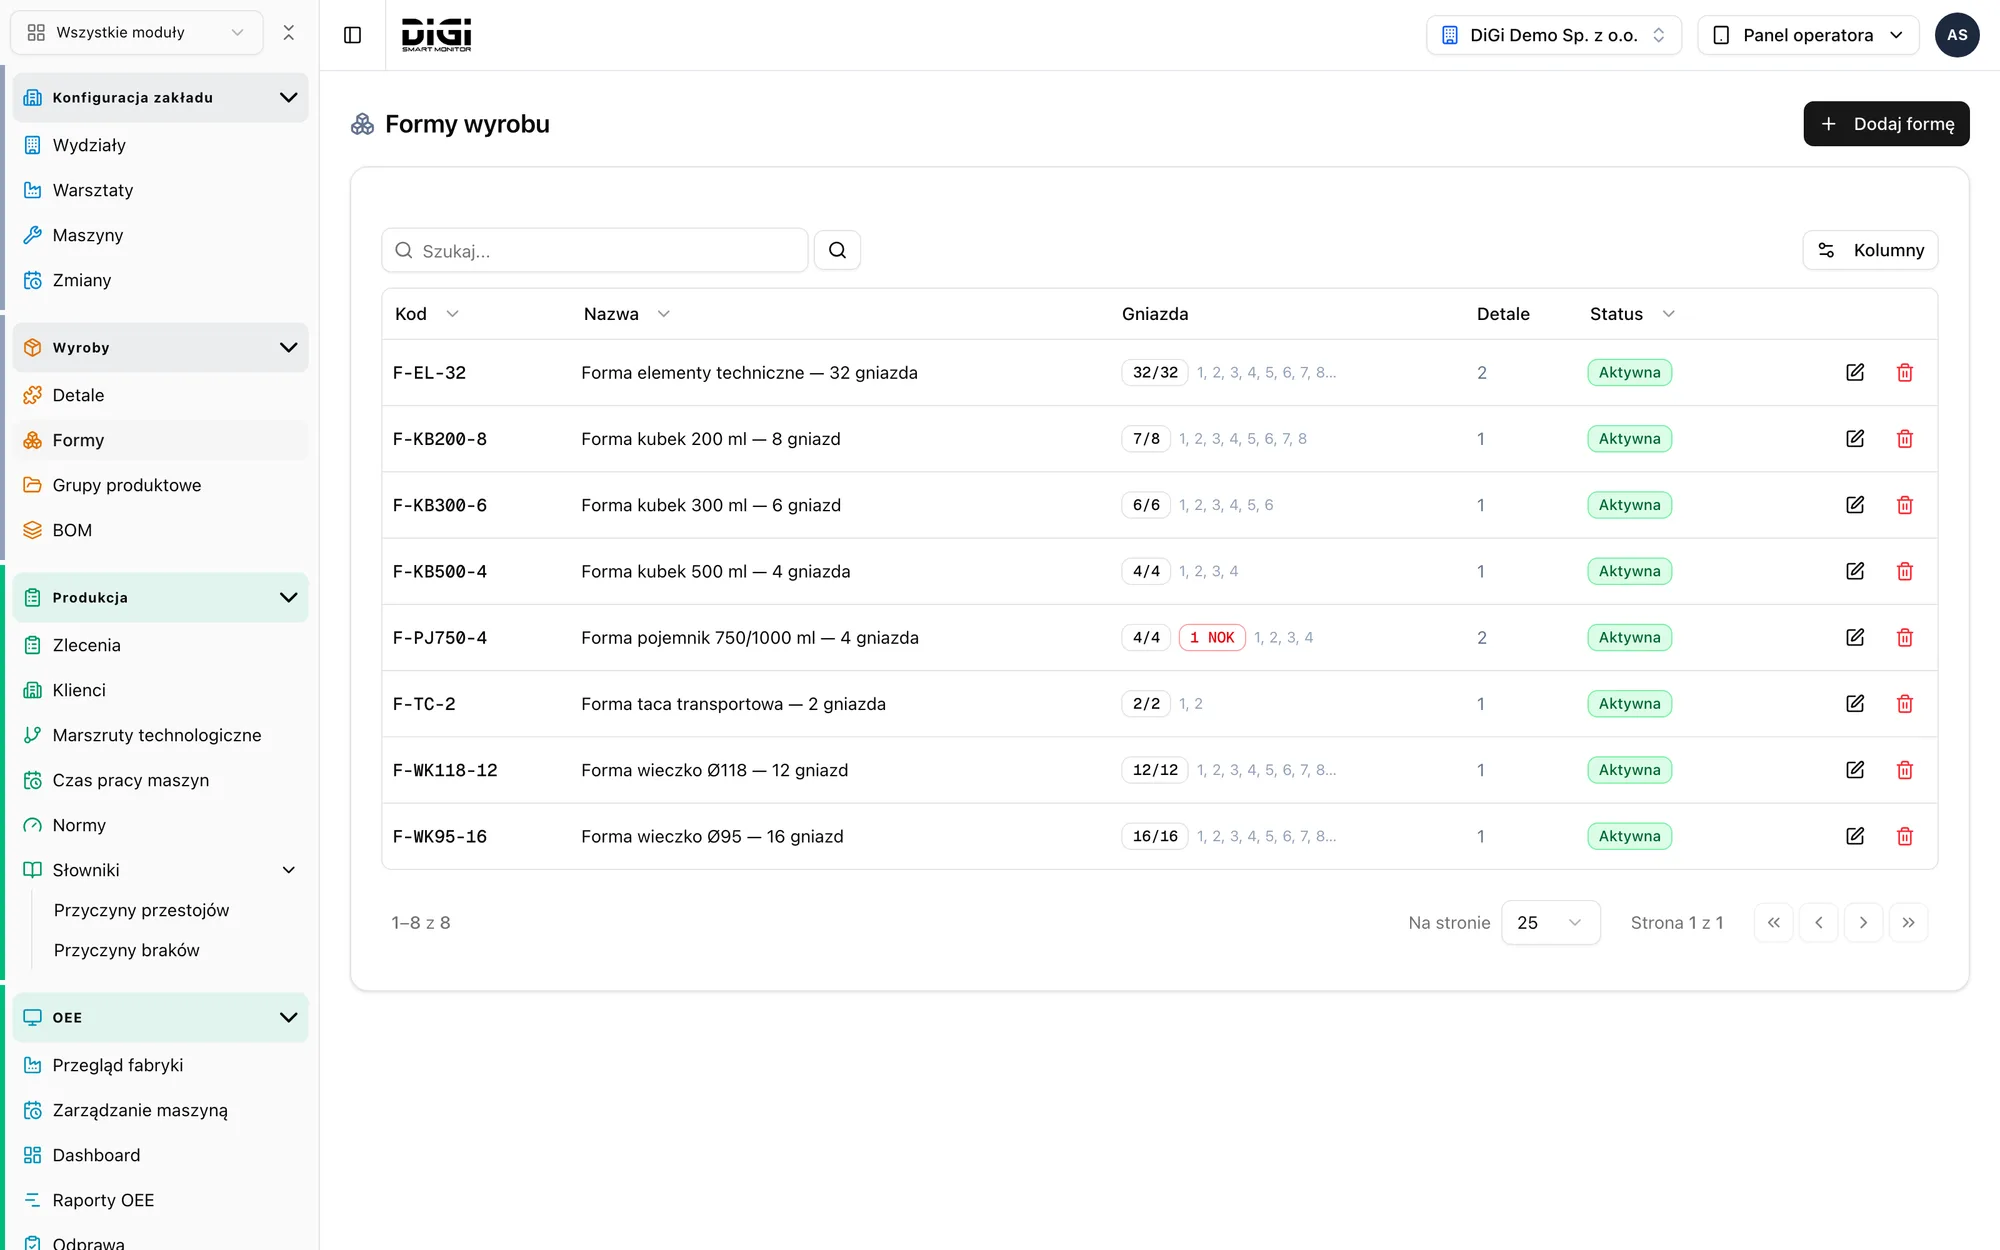
A blocked cavity is everyday life in a moulding shop. The system knows the mould and the number of active cavities, so one machine cycle is exactly as many pieces as cavities running. Performance and rejects are neither inflated nor understated.
Planned time comes from the shift calendar and the machine's working hours, and planned breaks do not burden the indicator. People do not argue with OEE, because the denominator is honest.
Reports
A new breakdown takes a minute, not a spreadsheet
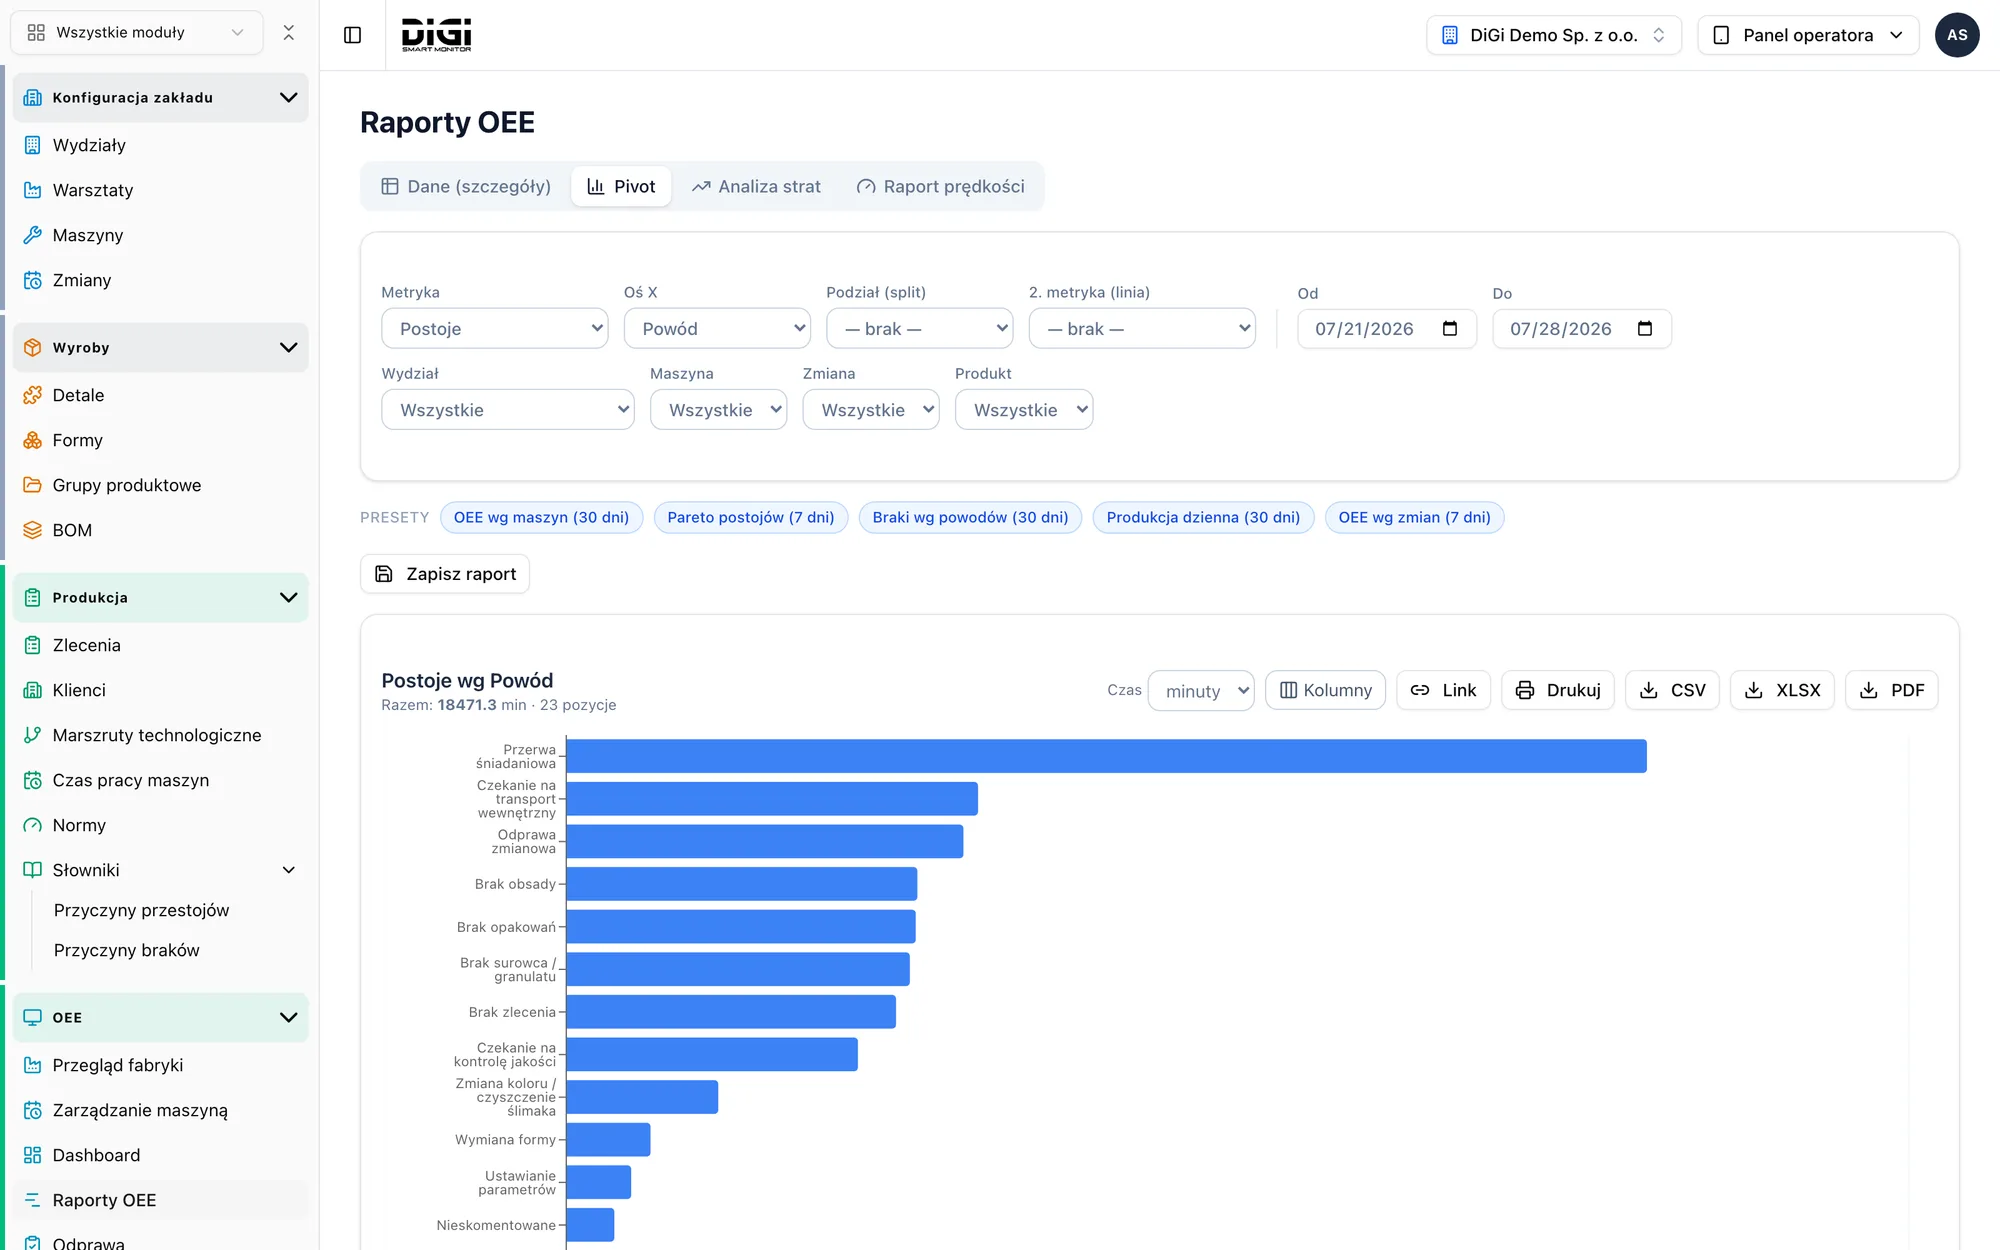
You pick the metric, the axis and the split: downtime by reason, OEE by machine, rejects by cause, daily production. Plus filters by department, machine, shift and product, and ready presets for the most common questions.
You export every report to spreadsheet, CSV and PDF, or save it and share a link. The shift, daily and weekly report can be sent automatically by e-mail, on a schedule.
What else is in the system
An honest denominator
Three classes of planned time. The machine is not penalised for time it was not meant to run, so people do not argue with the indicator.
Moulds and disabled cavities
Counting stays right also when a mould runs on part of its cavities, which is everyday life.
Cycle ledger
The question "where does this number come from" has an answer down to a single cycle, even months later.
Corrections with an author and a time
The foreman closes the shift data in one place. Every correction has an author, so the data is fit for bonuses and audits.
Alerts during the shift
Notifications about stops and deviations reach the right person while something can still be saved.
Reports in any breakdown
Breakdowns by machine, shift, part and reason with export to spreadsheet and PDF. A new breakdown takes a minute.
The target visible on the floor
TV mode shows the shift result and target where it is being achieved.
The standard from data, not from memory
The speed report shows the actual rate on a part and a machine. Standards have a change history.
Grows with the plant
Orders, routings, service windows, multiple plants. From an OEE counter to production management without a second implementation.
Everyone sees what they need
Pick your role.
- Is it better than a month ago? One number, the same definition every month.
- How much capacity is idle? OEE, OOE and TEEP side by side.
- Which machines miss the target? OEE targets per machine and the gap to target on one screen.
- Do we need another machine? A decision on recoverable hours, not on a hunch.
- Do I have to log in? No, the shift and daily report arrives in the inbox.
Four steps, without stopping production
We start with one machine and recording on the tablet. You add the machine signal when you decide.
- Step 1
Choosing the machine and downtime reasons
One machine, its working calendar and a downtime reason dictionary written down with the shift leaders. One meeting, usually online.
- Step 2
Pilot on one machine
A tablet at the machine, the operator records start, stops and pieces. Operator and leader training during the first shift.
- Step 3
Adjustments on data
After two or three weeks we review the timeline and the loss list: reasons, standards, planned time, the shift report.
- Step 4
More machines and the machine signal
More machines join, a gateway from the controller or a sensor, alerts, reports by e-mail and order exchange with ERP.
Smart Monitor pilot on one machine: 5,000 PLN
Launch, configuration, training. The first data from the floor after two weeks, without stopping production.
Common questions
Check OEE on one machine
We reply within 24 hours

Piotr will help you pick the solution that fits your production processes.
Phone: (+48) 668 211 736
Email: digismartcontrol@gmail.com